Lesson Answer Keys
Energy Units Math Challenge
Energy Challenge Math Problems – Answer Key
- Kilowatt-hours = Watts x Hours / 1,000
60 x 10 = 600
600 / 1000 = 0.6 kWh - A kilowatt-hour represents one kilowatt of power used for one hour.
2 x 3 = 6 kWh - 0.15 x 150 = $22.50
- Work (J) = Force (N) x Distance (m)
10 x 5 = 50 J - A calorie is equal to the energy needed to raise the temperature of 1 gram of water by 1°C.
200 x 10 = 2000 calories - 100 x 5 = 500
500 /1000 = 0.5 kWh - Energy (J) = Power (W) x Time (sec)
1200 x 180 = 216,000 J - Potential Energy (J) = Mass (kg) x Gravity (9.8 m/s2) x Height (m)
5 x 9.8 x 2 = 98 J - Energy (kWh) = Power (kW) x Time (hr)
2000 x 24 = 48,000 kWh - Kinetic Energy (J) = ½ x Mass (kg) x v2 (m/s)
½ x 2 = 1 and 4 x 4 = 16
1 x 16 = 16 J - Work (J) = Force (N) x Distance (m)
50 x 10 = 500 J - A kilocalorie is equal to 1,000 calories
2.5 x 1000 = 2,500 cal - Energy (GWh) = Power (GW) x Time (hr)
1 x 24 = 24 GWh - 15,000 x 3 = 45,000 BTU
- 2 x 7 = 14
14 x 100,000 = 1,400,000 BTU - One horsepower is approximately 746 watts.
300 x 746 = 223,800 BTU - Work (ft-lb) = Force (lb) x Distance (ft)
10 x 3 = 30 ft-lb - Energy (kWh) = Power (kW) x Time (hr)
0.3 x 6 = 1.8 kWh
Energy Units Crossword Puzzle – Solution

Across
[2] A unit of energy, often used in nutrition, equal to the energy needed to raise the temperature of 1 gram of water by 1°C.
[4] Equal to 1,000 megawatts or 1 billion watts; used for large-scale power measurements.
[8] Equal to 1,000 watts; used to measure the power of appliances.
[9] A unit of power measuring the rate of energy transfer (1 joule per second).
[10] The amount of heat required to raise the temperature of 1 pound of water by 1°F.
[12] A unit of heat energy equal to 100,000 BTUs, often used for natural gas.
[14] A unit of power measuring the output of engines; 1 hp is approximately 746 watts.
Down
[1] A measure of energy representing one kilowatt of power used for one hour.
[3] The form of energy an object possesses due to its motion.
[5] Equal to 1,000 kilowatts or 1 million watts, often used for power plants
[6] The energy held by an object because of its position or state.
[7] A unit of energy, often used on food labels, equal to 1,000 calories.
[11] A unit of work or energy, equal to the energy needed to lift one pound, one foot.
[13] A unit of energy; the amount of energy transferred by applying a force of one newton over a meter.
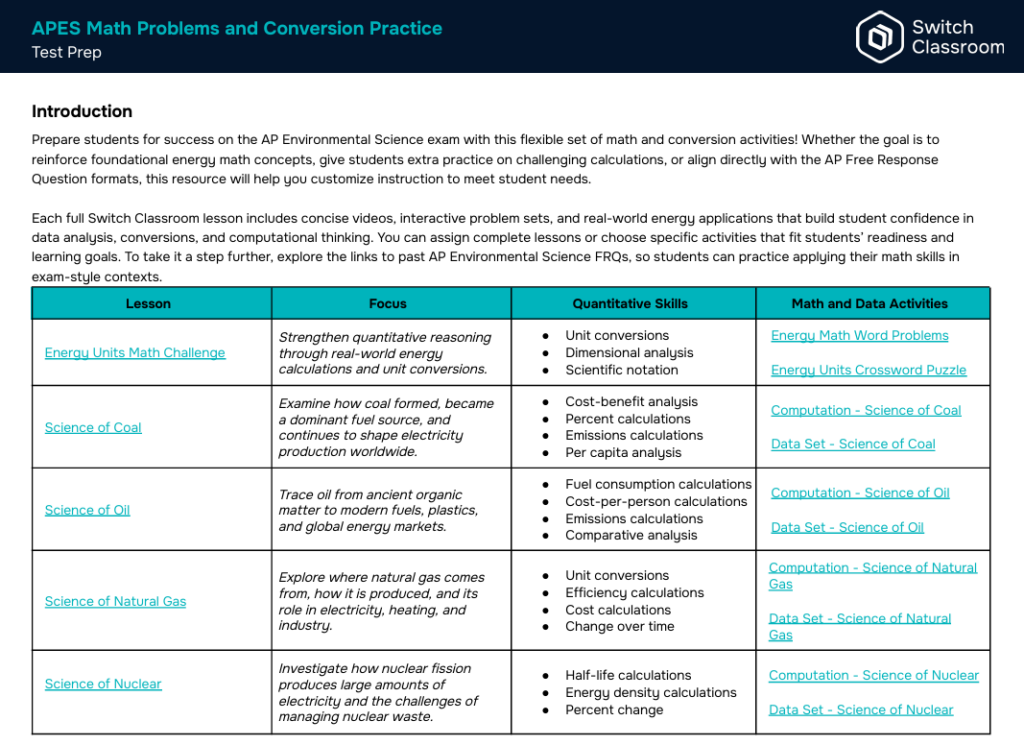
Science of Coal
Computation
The Student Guide contains the Science of Coal – Computation activity.
Answer Key: Q1: China: [(4939 – 4883) / 4883] x 100 = 1.1%, India: [(1315 – 1245) / 1245] x 100 = 5.6%
Q2: ASEAN: [(491 – 457) / 457] x 100 = 7.4%
Q3: 2023: (457 / 8687) x 100 = 5.3%, 2027: (567 / 8873) x 100 = 6.4%
Q4: China: (9439 x 109 kg) / (1.409 x 10⁹ people) = 3505 kg/person, India: (1315 x 109 kg) / (1.451 x 10⁹ people) = 906 kg/person, U.S.: (368 x 109 kg) / (340.1 x 10⁶ people) = 1082 kg/person
Q5: Use the formula: [(2027 value – 2023 value) / 2023 value] x 100
China: 2.5%
India: 4.2%
ASEAN: 24.1%
U.S.: -14.2%
EU: -31.1%
Rest of World: -4.3%
Q6: 8873 Mt – 8687 Mt = +186 Mt increase
Data Set
The Student Guide contains the Science of Coal – Data Set.
Answer Key: Question 1: 1950 – United Kingdom; 2000 – United States; 2023 – China.
Question 2: Answers will vary. (Example: Countries that are currently developed like the U.K., U.S. and Germany, saw a steady rise in emissions through the industrial revolution into the 20th century, while currently developing countries, like China and India, did not start to increase their emissions until the late 20th century. In 2023, the UK, US and Germany have reached their peak emissions and have since shown steady decline, while China and India continue to steadily increase.)
Question 3: Answers will vary. (Example: The U.S. is a developed country and experienced rapid industrialization in the late 19th century and reached peak emissions in the early 20th century. It has since started transitioning away from coal in many sectors, toward natural gas and lower-emission energy options. China is a developing country and is still in its industrialization phase, starting its emissions increase in the late 20th century, close to one hundred years after the U.S. began increasing its coal emissions.)
Question 4: Answers will vary. (Example: Positive impacts include industrial growth that improves incomes and infrastructure. Negative impacts include worsening air pollution and higher greenhouse gas emissions.)
Question 5: Answers will vary. (Example: The United Kingdom was one of the first industrialized nations, so its coal use peaked early. Over time, the UK phased out coal in favor of oil, gas, nuclear and other lower-emission options.)
Science of Oil
Computation
The Student Guide contains the Science of Oil – Computation activity.
Answer Key: Q1: Cadillac: (1) 2400/20 = 120 gallons; (2) 120 x 20 = 2400 lbs; Mini Cooper: (1) 2400/30 = 80 gallons; (2) 80 x 20 = 1600 lbs; Hyundai Hybrid: (1) 2400/50 = 48 gallons; (2) 48 x 20 = 960 lbs.
Q2: Cadillac: (1) 120 x 3 = $360; (2) 360/5 = $72; Mini Cooper: (1) 80 x 3 = $240; (2) 240/5 = $48; Hyundai Sonata: (1) 48 x 3 = $144; (2) 144/5 = $28.80.
Q3: (1) 4.88 x 3 = 14.64 gallons/person
Q4: (1) 2400 x 53 = 127,200 lbs; (2) 127,200/160 = 795 lbs/person.
Q5: (1) Hyundai Hybrid; (2) Mini Cooper; (3) Cadillac; (4) Plane.
Q6: Answers will vary.
Data Set
The Student Guide contains the Science of Oil – Data Set.
Answer Key: Question 1: (Answers will vary) Example: Development of new technologies such as fracking and horizontal drilling; government incentives to increase energy independence and security.
Question 2: Example: Increased greenhouse gas emissions and water and land pollution; answers will vary. Question 3: Answers will vary.
Question 4: (Answers will vary) Example: Focus on other energy sectors and technologies.
Question 5: (Answers will vary) Example: The Middle East produces the most oil, followed by North America. The other regions have some big hitters, but trail behind in comparison.
Science of Natural Gas
Computation
The Student Guide contains the Science of Natural Gas – Computation activity.
Q1: Energy per day: 2400 ft2 × 60 BTUs per ft2 = 144,000 BTUs per day
Total energy over 90 days: 144,000 × 90 = 12,960,000 BTUs
12,960,000 BTUs / 1030 BTU per ft3 = 12,582.52 ft3
12,582.52 ft3 / 1000 = 12.58 mcf
Q2: Actual gas needed = energy needed / efficiency of furnace
12.58 mcf / 0.8 = 15.725 mcf
Cost = Actual gas needed × Cost per mcf
15.725 mcf × $6.00 per mcf = $94.35
Q3: 12.58 mcf / 0.9 = 13.98 mcf
13.98 mcf × $6.00 per mcf = $83.88
$94.35 – $83.88 = $10.47 (3 months)
$10.47 × 4 = approximately $41.88 saved over a year
Data Set
The Student Guide contains the Science of Natural Gas – Data Set.
Answer Key: Question 1: Natural gas showed the most consistent increase in production from 2000 to 2023. Answers will vary. (Example: This consistency might be because many countries are investing in natural gas due to it being a better alternative (with regard to emissions) to coal in power plants. It’s also used in heating and industry, which keeps demand stable.)
Question 2: Between 2000 and 2023, coal had the largest absolute increase (49,789.16 TWh – 26,812.19 TWh = 22,976.97), way above oil and gas. Answers will vary. (Example: Coal’s large increase may be due to industrial growth in developing countries that still rely heavily on coal for electricity. It’s often cheaper and more available than other fuels.)
Question 3: Answers will vary.
Question 4: Natural gas shows a smoother and steadier growth line than coal and oil, but it is also the least produced of all three. While coal and oil had some drops (especially around 2020), natural gas didn’t dip much. At the same time, all three are trending up (increasing) overall, with oil being the most produced, followed by coal, then natural gas.
Question 5: Answers will vary. (Example: To support growing gas production, a country would need to invest in drilling technology and equipment, pipelines to transport the gas, storage facilities, and export terminals like liquefied natural gas (LNG) ports. They would also need safety and regulation systems, as well as new power plants that use natural gas efficiently, and expansion of their grid.)
Science of Nuclear
Computation
The Student Guide contains the Science of Nuclear – Computation activity.
Answer Key: Q1: 886 kWh/month x 12 months/year x 1.12 pounds coal/kWh = 11,900 pounds of coal
Q2: 886 kWh/month x 12 months/year x 1 MWh/1000 kWh x 0.007 pounds Uranium/MWh = 0.074 pounds of uranium
Q3: % difference = difference between values/average of values x 100
79,999,945 MJ/kg40,000,028 MJ/kg x 100 = 200%
Q4: % difference = difference between values/average of values x 100
39 MJ/kg35.5 MJ/kg x 100 = 110%
Q5: c) 10 grams
Explanation: 7,190 ÷ 5,730 = 3 half-lives
80 → 40 → 20 → 10 grams
Q6: c) 8 days
Explanation: 160 → 80 → 40 grams = 2 half-lives
16 days ÷ 2 = 8-day half-life
Q7: b) 3
Explanation: 10 → 5 → 2.5 → 1.25 → 3 halvings = 3 half-lives
Q8: c) 8 grams
Explanation: 13.5 ÷ 4.5 = 3 half-lives
64 → 32 → 16 → 8 grams
Data Set
The Student Guide contains the Science of Nuclear – Data Set.
Answer Key: Question 1: Germany’s nuclear power output declined after 2000 and dropped to 0 by 2023, showing a move away from nuclear energy. China rapidly increased its nuclear output, showing strong investment in nuclear for future energy needs.
Question 2: Answers will vary. (Example: Most U.S. reactors are old, and few new ones have been built due to high costs, long timelines, and stricter safety regulations.)
Question 3: Answers will vary. (Example: The Fukushima disaster in 2011 was a major nuclear accident caused by an earthquake, and it caused Japan to shut down many reactors and rethink its energy strategy for safety.
Question 4: Answers will vary. (Example: China is most likely to grow its nuclear share because of high demand for energy and government support for expanding nuclear energy.)
Question 5: Answers will vary. (Example: The global trend will likely lean toward expansion as countries seek low-carbon energy, though safety concerns and high cost will make this expansion slow.)
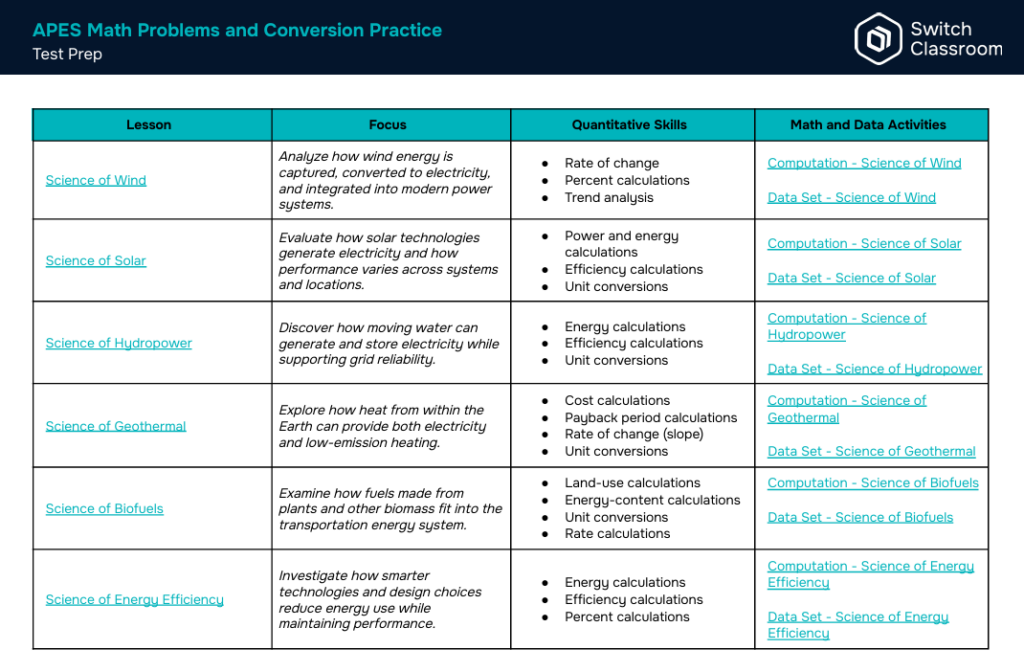
Science of Wind
Computation
The Student Guide contains the Science of Wind – Computation activity.
Answer Key: Q1: (2304.44 – 345.92) / 13 = 150.66 TWh/year
Q2: 2020-2021 saw the largest increase of 258.79 TWh. Q3: (2304.44 / 29,429.05) = 0.783 = 7.83%
Q4: 2304.44 + (2 x 150.66) = 2605.76 TWh
Q5: (Answers will vary) Example: Falling costs of wind technology, government policies and subsidies, technological advancements, environmental concerns, energy security.
Data Set
The Student Guide contains the Science of Wind – Data Set.
Answer Key: Question 1: In the late afternoon/early evening (5 PM – 7 PM). This could be because people are returning home from work or school and turning on appliances, lights, electronics, etc. It’s also one of the hottest parts of the day, increasing cooling needs.
Question 2: No. Wind output is higher in the early morning hours and lower during the afternoon and evening, which is when electricity demand peaks.
Question 3: (Answers will vary) Example: Turbines can only generate near capacity when wind speeds are optimal; the wind may simply not be strong enough.
Question 4: (Answers will vary) Example: Geography and availability of water resources; cost of installation; fuel access; environmental impact.
Question 5: (Answers will vary) Example: Energy storage systems; complementary energy systems.
Science of Solar
Computation
The Student Guide contains the Science of Solar Computation activity.
Answer Key:
Q1: (5000 watt/generator) x (1 panel/200 watt) = (5,000 panel/200 generators) = 25 panels/1 generator
Q2: A) Daily output per panel = 300 W × 5 h = 1,500 kWh = 1.5 kWh
Annual output = 1.5 kWh × 365 = 547.5 kWh
B) Number of panels = 900,000 kWh ÷ 547.5 kWh ≈ 1,644 panels
C) Improved output = 547.5 kWh × .20 = 109.5 kWh 547.5 kWh + 109.5 kWh = 657 kWh
Panels needed = 900,000 kWh ÷ 657 kWh/panel ≈ 1,370 panels
Panels saved = 1,645 panels – 1,370 panels = 275 panels
Q3: A) Daily output per home = 6 kW × 4 h = 24 kWh
Annual output per home = 24 kWh × 365 = 8,760 kWh
Total annual output for 1,250 homes = 8,760 kWh × 1,250 homes = 10,950,000 kWh
B) Total CO₂ avoided = 10,950,000 kWh × 0.5 kg/kWh = 5,475,000 kgConvert to metric tons: 5,475,000 kg ÷ 1,000 = 5,475 metric tons CO₂ avoided annually
Data Set
The Student Guide contains the Science of Solar – Data Set.
Answer Key: Question 1: Total = 49.84 + 834.10 + 70.99 + 133.81 + 303.17 = 1391.91
China’s share = 834.10 ÷ 1391.91 ≈ 60%
Question 2: Answers will vary. (Example: Australia may have less developed solar infrastructure or lower energy demand due to its smaller population, while Germany has made significant investments and policies supporting solar energy, leading to higher production relative to its size.)
Question 3: Answers will vary. (Example: China’s far higher solar production suggests greater government investment, stronger policy incentives, or higher national energy demand compared to Australia.)
Question 4: Answers will vary. Question 5: Answers will vary.
Science of Hydropower
Computation
The Student Guide contains the Science of Hydropower – Computation activity.
Question 1: 12 million MWh x 0.80 = 9.6 million MWh
Question 2: 15 million MWh x 0.90 = 13.5 million MWh of usable energy
Question 3: Yes. The region’s demand is 12 million MWh per year, and the dam is able to produce 13.5 million MWh per year. 13.5 million MWh – 12 million MWh = 1.5 million MWh excess power
Question 4: 13.5 million MWh x 1000 = 13,500,000,000 kWh
13,500,000,000 kWh / 10,000 = 1,350,000 homes
Question 5: Answers will vary. Student answers should be comprehensive and consider multiple factors including carbon dioxide emissions, cost, displacement of people and disruption of ecosystems, etc.
Data Set
The Student Guide contains the Science of Hydropower – Data Set.
Answer Key: Question 1: Between 1985 and 2023, China and Russia increased their share of hydroelectric power. China increased 2.3% (6.7 – 4.4) and Russia increased 1.1% (6 – 4.9).
Question 2: No, not necessarily. A decrease in the share of hydroelectric power doesn’t always mean a country is producing less of it. It could mean that the total energy demand has grown and other energy sources (such as fossil fuels or solar, nuclear and wind) have increased even faster. So the hydroelectric output might be the same or even higher, but its percentage of the total energy mix has gone down.
Question 3: Answers will vary. (Example: Positive impacts include (environmental) reduced greenhouse gas production, cleaner air quality, less acid rain and (economic) job creation, lower long-term cost of operation, less damage from flooding. Negative impacts include (environmental) disruption of habitats/ecosystems, increased sedimentation, increased methane production in tropical regions due to the breakdown of organic material and (economic) high initial costs, displacing communities.
Question 4: Answers will vary. (Example: Countries may be focusing on developing and innovating other low-emission energy sources, such as wind and solar. Hydropower has been used for many years and is a stable energy source limited by the geography and availability of moving water.)
Question 5: Answers will vary. (Example: Norway has abundant mountainous terrain and steep rivers, making it ideal for building hydroelectric dams. Norway is also a wealthy nation that adopted hydropower early and has consistently maintained their dam systems. There is strong political commitment to sustainability and energy independence, with policies that support state-owned hydro companies and investment in sustainable energy.)