
Bell Ringer
Instructions: Select one of the Bell Ringers for students to reflect on and answer.
Vocabulary Lists
Instructions: Go over important terms and their definitions before watching The Demand Curve video and Scale video. The student vocabulary lists are also in the Student Guide and Energy Demand and Scale – Starter Pack.
The Demand Curve Vocabulary List
| Word | Definition | Example |
|---|---|---|
| Generator | noun; a machine that converts mechanical energy into electrical energy | “Every time we turn a light on or anything else, there’s a generator turning somewhere to power it.” |
| Demand | noun; the amount of energy people want and are able to use at a given time | “ . . . the more electricity we need, the more generators we have to turn on right at that very instant . . . to meet our demand for electricity.” |
| Base Load | noun phrase; the minimum amount of electricity a power grid needs to supply at all times | “When people are sleeping, there’s still electricity demand . . . We call that base load.” |
| Hydro | noun; short for hydropower, which is energy made by using moving water to turn turbines, which often involves dams | “Lots of natural gas generation comes on and some major hydro plants.” |
| Demand Curve | noun phrase; a graph that shows how energy demand change over time or with price | “The demand curve drives the entire electricity system.” |
Scale Vocabulary List
| Word | Definition | Example |
|---|---|---|
| Scale | noun; the size or level of something, especially in comparison to others | “Scale is the one energy challenge that drives all others, and we are the solution.” |
| Infrastructure | noun; the systems and structures, like roads, power lines, and water pipes, needed for a society to function | “The world of energy is slow to change because the scale of infrastructure is so massive.” |
| Industrial | adjective; related to factories or large-scale production of goods and energy | “ . . . taking a game-changing technology from the lab to rolling it out at the huge industrial scale where it can make a difference takes dozens of years.” |
| Emissions | noun; gas or particles released into the air, especially by cars, factories, and power plants | “Because the scale of energy is so huge, emissions are also often huge.” |
| Watt-hours | noun; a unit of energy that is equal to one watt of power consumed for one hour of time | “The global average [of energy consumption] is 20 million watt-hours per year and rising.” |
| Staggering | adjective; extremely large or surprising in amount or effect | “Population times personal consumption. That’s the reason for the staggering scale of energy.” |
Quizzes
Instructions: Review key concepts after watching The Demand Curve video and Scale video. The Student Guide and Energy Demand and Scale – Starter Pack contain the quizzes.
The Demand Curve Quiz Answer Key: Q1:B Q2:C Q3:A Q4:D
Scale Quiz Answer Key: Q1:C Q2:C Q3:C Q4:A
Data Set
Instructions: Provide students with the Energy Demand and Scale – Data Set for data literacy and analysis practice.
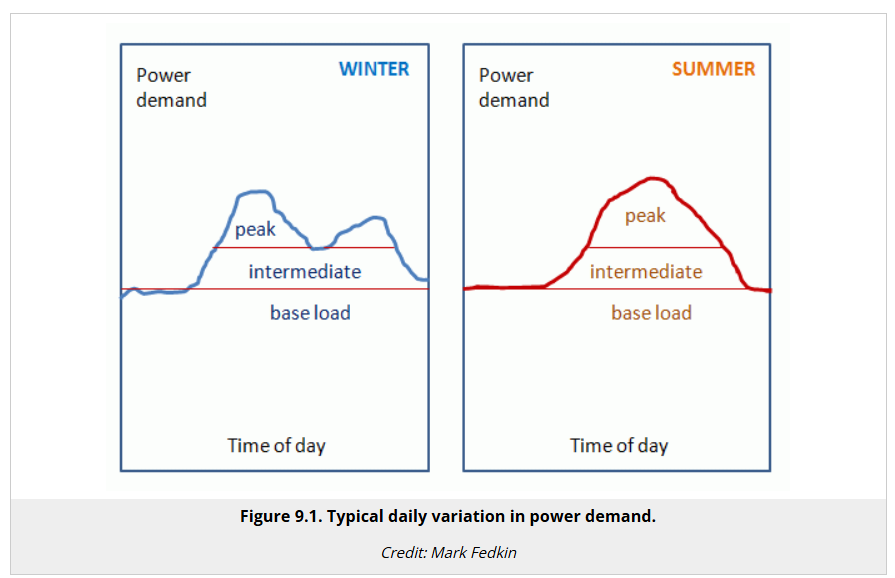
Note: In the graphs above, the x-axis labeled “Time of day” represents a 24-hour cycle beginning at 12:00 AM. If divided into four equal intervals starting at the origin (where the x- and y-axes intersect), the points along the axis would correspond to 12:00 AM, 6:00 AM, 12:00 PM, and 6:00 PM.
Daily Energy Use Patterns
Electricity generation throughout the day depends on the balance between base load, intermediate load, and peak load sources. Grid operators continuously balance these resources to ensure reliable power at all times.
Base Load (Nighttime and Minimum Demand):
During low-demand periods—like at night—steady, continuous sources such as coal, nuclear, or hydropower provide electricity. These plants operate around the clock due to their efficiency and low fuel costs, maintaining the grid’s steady baseline supply.
Intermediate Load (Daytime, Variable Demand):
As demand rises during the day, renewable sources like solar and wind contribute significantly when weather and sunlight allow. However, because their output fluctuates, they supplement rather than replace the constant base load.
Peak Load (High Demand Periods):
During demand spikes—such as hot afternoons or cold mornings—flexible and fast-starting sources like natural gas, oil, and hydropower are brought online. These can quickly adjust output to meet short-term increases in electricity use.
Answer Key: Question 1: Explanations may vary. (Sample response: In winter, the demand curve shows two noticeable peaks, one in the morning and another in the evening. In summer, the demand steadily increases during the day, resulting in one peak in the late afternoon. The differences could be because in winter, people mainly use electricity for heating in the morning before work and in the evening after they return home, while in summer, the main driver is air conditioning, which runs strongest during the hot afternoon and evening.)
Question 2: Explanations may vary. (Sample response: In both winter and summer, demand is lowest late at night, from around 12-5AM. In winter, the highest demand is in the morning, around 7-9AM, while in summer, the highest demand is in the afternoon, around 3-8PM. The difference could be because in winter, the most energy is needed when people wake up and turn on heating, lights and appliances, and get businesses up and running. In summer, the most energy is needed during the hottest time of the day, for air conditioning and evening activities.)
Question 3: Explanations may vary. (Sample response: The base load includes systems that never shut off and need to run all the time or all night. For example, refrigerators, freezers, water heaters, internet servers, streetlights, hospital equipment, and some industrial machinery.)
Question 4: Explanations may vary. (Sample response: Wind and solar are good for intermediate loads, because their production often matches daily demand patterns. For example, solar panels produce the most electricity during the day, when people are awake and using more power. Challenges include variability (cloudy days, nighttime, calm winds) and the need for storage or backup systems to ensure steady energy supply.)
Question 5: Explanations may vary. (Sample response: Natural gas plants can start up and shut down quickly, which makes them ideal for sudden peaks in demand. Coal and nuclear plants take much longer to adjust and are designed to run steadily, not stop and start.)
Question 6: Explanations may vary. (Sample response: On the 4th of July, the demand curve might show a dip in the morning as people may be sleeping in or outdoors, but will likely rise sharply in the evening, when people gather, cook, and use lights and air conditioning. Utilities could prepare by scheduling more flexible generation, encouraging off-peak usage, or even using demand-response programs that reward customers for shifting energy use.)
Question 7: Explanations may vary. (Sample response: In a country with less technology and infrastructure, the curve would be flatter and lower overall. Fewer appliances, little to no air conditioning, and less industry mean smaller peaks. The biggest rise might happen in the evening when people turn on lights, but the difference between peak and base load would be much smaller.)
Question 8: Explanations may vary. (Sample response: Technologies include energy storage like batteries, smart grids, efficient appliances, and demand-response programs that reward customers for shifting energy use. Behaviors include running dishwashers or laundry at night, adjusting thermostats, using energy-efficient lighting and appliances, and shifting industrial use to off-peak times.)
Demand Curve and Scale CER Activity
Instructions: Provide students with the Demand Curve and Scale CER Activity for a deeper dive into the big ideas of energy supply and demand.
To build students’ background knowledge and provide them with evidence to support their claim, consider assigning the following resources to students:
From this lesson: Energy Demand and Scale
- Energy Demand and Scale Starter Pack, including The Demand Curve and Scale videos.
- Energy Demand and Scale Data Set
Additional Switch Classroom Resources
EarthDate Resources (PDF or audio)
- EarthDate: Powering the World
- EarthDate: Energy Born of Earth
Answer Key: Step 1: Claim: (Student Sample Response): I believe that both managing demand and building new power plants are equally important, because we need short-term solutions to balance the grid, and long-term solutions to meet future growth.
Step 2: Evidence: (Student Sample Response): First, electricity needs to be supplied instantly to meet demand. If demand spikes too high, utilities may need to use expensive or high-emission power plants. Managing demand through efficiency and timing helps reduce these spikes and their subsequent costs. Second, large scale power plants are needed to meet future demand, but can take decades to plan and build. For example, France needed over 20 years to scale its nuclear fleet. Without new supply, long-term energy needs won’t be met.
Step 3: Reasoning: (Student Sample Response): Both managing demand and building new power plants matter because the demand curve shows that electricity supply and demand must always stay balanced. Managing demand reduces waste and flattens peaks right away, making the system more reliable and affordable. At the same time, scale reminds us that we can’t meet tomorrow’s needs with efficiency measures alone. New plants will provide the steady base load that societies will require as populations grow.
Step 4: Counterclaim: (Student Sample Response): Some people might argue that managing demand is more important, because efficiency and conservation measures can be implemented much faster and save money compared to building new plants.
Step 5: Rebuttal (Student Sample Response): That’s true in the short-term, but without new plants, we risk falling behind in total supply as demand continues to grow. Demand management alone cannot carry the entire burden of future energy needs.
Step 6: Real-World Connection (Student Sample Response): Rolling blackouts in California show what happens when demand spikes beyond supply. Managing demand with efficiency programs could reduce peaks, but at the same time, California needs to invest in new power plants to add long-term supply. Both approaches are necessary.
Step 7: Visual Representation: (Student Sample Response): The first curve would show base load and sharp peak load. The second curve could show the peak flattened slightly by demand management, but the supply line also rising to represent new plants. Base load could be labeled with nuclear, geothermal and/or coal; peak supply could be labeled with solar and wind with storage and/or natural gas.
Exit Ticket
Instructions: Access the Exit Ticket and have students reflect on and answer the prompt.