
Bell Ringer
Instructions: Select one of the Bell Ringers for students to reflect on and answer.
Vocabulary
Instructions: Go over important terms and their definitions before watching the Science of Energy Efficiency video. The student vocabulary list can be found in the Student Guide and Science of Energy Efficiency – Starter Pack.
| Word | Definition | Example |
|---|---|---|
| Commodity | noun; a raw material or basic good that can be bought, sold, or traded | “By now, you may be getting the idea that electricity is a precious commodity . . .” |
| Power Plant | noun phrase; a facility where energy is converted to electricity for use | “Most power plants produce emissions when they make electricity.” |
| Emissions | noun; pollutants or gases released into the air | “Most power plants produce emissions when they make electricity.” |
| Peak Electric Load | noun phrase; the largest quantity of electricity needed at one time in a specific area | “Reducing the peak electric load . . . keeps the grid stable when it’s nearly maxed out, and saves electricity when it’s most expensive.” |
| Grid | noun; a network of power plants, wires, and equipment that delivers electricity to homes and businesses | “Reducing the peak electric load . . . keeps the grid stable when it’s nearly maxed out, and saves electricity when it’s most expensive.” |
| Efficiency | noun; using less energy to do the same task or produce the same result, without wasting resources | “Efficiency is the most important step we can take in energy.” |
Quiz
Instructions: Review key concepts after watching the Science of Energy Efficiency video. The Student Guide and Science of Energy Efficiency – Starter Pack contain the quiz.
Answer Key: Q1:D Q2:B Q3:B Q4:D
Computation
Instructions: Provide students with the Science of Energy Efficiency – Computation activity for math integration and practice.
A traditional incandescent light bulb uses 60 watts of power and is turned on for 5 hours each day. An LED bulb with the same brightness uses only 10 watts.
Answer Key: Q1: 60W x 5hr = 300Wh per day
Q2: 10W x 5hr = 50Wh per day
Q3: 300Wh – 50Wh = 250Wh saved per day
Q4: 250Wh / 1,000 = 0.25kWh
0.25kWh per day x 30 days = 7.5kWh
7.5kWh x $0.17 = $1.28 saved per month
Q5: $1.28 x 12 months = $15.36
$15.36 x 40 = $614.40 saved per year
Data Set
Instructions: Provide students with the Science of Energy Efficiency – Data Set for data literacy and analysis practice.
The graph below shows the energy intensity for some various electrical uses. Energy intensity describes how much energy is used to provide a household service, such as heating, cooling, or lighting. When energy intensity decreases, it usually means homes are providing the same services while using less energy, often due to improvements in technology or efficiency.
Residential Energy Intensity, 2000-2023, United States
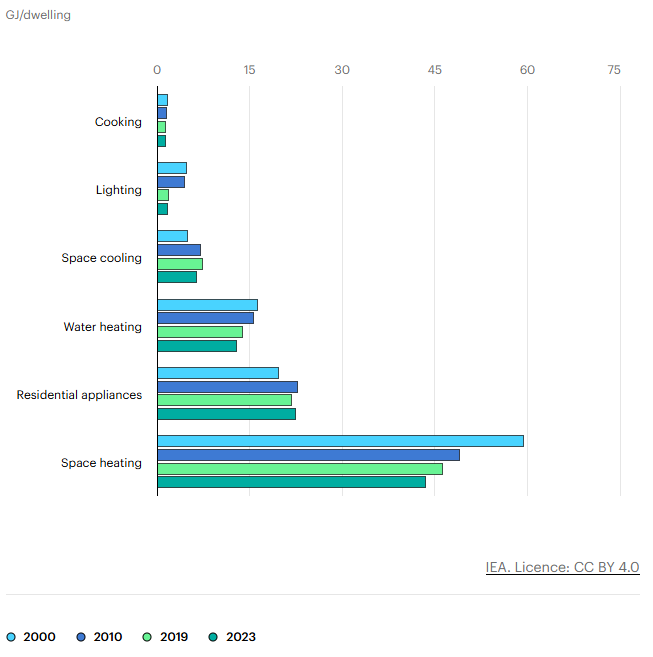
Source: IEA
Answer Key: Question 1: (Sample Student Response: Overall, residential energy intensity in the United States decreases from 2000 to 2023 for most household uses. This suggests that homes are providing the same services while using less energy, likely because of improvements in energy efficiency. Better appliances, improved building design, and newer technologies allow households to heat, cool, and power homes more efficiently than in the past.)
Question 2: (Sample Student Response: One use that does not follow the general decreasing pattern as clearly is space cooling. Its energy intensity does not drop as much as other categories. A possible explanation is that more homes now use air conditioning, especially in warmer regions, and people may cool their homes more often or to lower temperatures. Climate change and rising average temperatures could also increase the demand for cooling, offsetting efficiency improvements.
Question 3: (Sample Student Response: Space heating shows a clear decrease in energy intensity from 2000 to 2023. This change can be explained by improvements in home insulation, windows, and heating systems. The graph shows that space heating drops significantly over time, indicating that efficiency improvements in buildings and heating technology have had a major impact.
Lighting also shows a noticeable decrease in energy intensity. This is likely due to the widespread use of LED and other types of energy-efficient light bulbs, which use much less energy than traditional incandescent light bulbs while providing the same or better light.)
Question 4: (Sample Student Response: Total residential energy use could still increase even if energy intensity is decreasing because there may be more homes or larger homes over time. If the number of households increases, the total energy used can go up, even if each home is using energy more efficiently. People may also use more energy services, such as owning more appliances or using air conditioning more often.)
Investigating Energy Efficiency Lab
Instructions: Use the Investigating Energy Efficiency Lab – Student Handout and the following Teacher Guide to conduct the activity.
Introduction
In this lab, students investigate how efficiently an electric heating device converts electrical energy into useful thermal energy by heating water. While electrical devices may appear to convert energy directly into a desired outcome, some energy is always lost to the surroundings as heat, sound or light. In this investigation, efficiency is estimated by comparing the electrical energy supplied to the device with the thermal energy gained by the water. Any energy used to heat the container or lost to the surroundings is considered inefficiency in the system. By measuring both the electrical energy input and the thermal energy gained by water, students calculate efficiency and analyze why no device is 100% efficient.
Student Objectives
Students will be able to
- Measure electrical energy input using power and time.
- Calculate thermal energy gained by water using mass, temperature change, and specific heat.
- Calculate the efficiency of an electric heating device.
- Explain why energy efficiency is always less than 100%.
- Connect appliance efficiency to energy conservation and environmental impact.
Materials (Per Group)
- Student Handout
- Calculator
- Electric kettle or hot plate and beaker
- Water
- Thermometer
- Digital scale
- Stopwatch or timer
- Measuring cup
- Kill-a-Watt or similar power meter*
Set-Up Options
Option A: Student-measured power
- Each group uses a Kill-a-Watt meter to measure real-time power (W). Instructions are provided in the Student Handout.
Option B: Teacher-provided power value
- All students are instructed to use the same heating device (e.g., hot plate).
- The teacher uses a Kill-a-Watt meter to measure power usage of the heating device ahead of time. Provide students with Power (W).
Safety Precautions
- Review safe handling of electrical devices.
- Warn students about hot surfaces and hot water.
- Ensure cords are kept away from water spills.
- Supervise all heating steps closely.
Procedure
- Divide students into groups of 2 or 3 and provide each group with the Student Handout.
- Review safety procedures with the class, emphasizing hot surfaces and electrical safety.
- Instruct students to carefully read and follow the instructions on the Student Handout to conduct the investigation.
- Instruct groups to carefully collect and record their data.
- After data collection, each group will share their results with the class.
- Compile class data on the board or shared document so students can compare efficiencies across multiple trials.
- Instruct each group to complete the analysis and conclusion sections of the Student Handout.
Answer Key
Data Table (Example values using an electric kettle; real student measurements will vary.)
| Power (W) | Time (s) | Input Energy (J) | Mass of Water (kg) | Initial Temp (°C) | Final Temp (°C) | Change in Temp (°C) | Output Energy (J) | Efficiency (%) |
|---|---|---|---|---|---|---|---|---|
| 1491 | 90.29 | 134,622.39 | 0.2335 | 19.22 | 92.78 | 73.56 | 71,899.8244 | 53.4 |
Analysis Questions Answer Key (Sample Student Responses)
Q1: The efficiency is less than 100% because not all of the electrical energy was transferred to the water. Some of the energy was used to heat the kettle itself, and some was lost to the surrounding air instead of increasing the water’s temperature.
Q2: Energy was lost as thermal energy to the air, heat absorbed by the kettle, and thermal energy carried away by steam as the water heated and began to boil.
Q3: Answers will vary.
Q4: Using multiple trials improves reliability because it reduces the impact of random errors. Averaging results helps ensure the calculated efficiency is closer to the true value and not affected by one unusual measurement.
Q5: Energy efficiency helps conserve energy by reducing wasted energy. When devices use energy more efficiently, less electricity is needed, which saves money and reduces the amount of natural resources used to produce energy.
Q6: The efficiency could be improved by adding better insulation to the kettle, heating only the amount of water needed, and using materials that conduct heat more effectively.Q7: Answers will vary.
Exit Ticket
Instructions: Access the Exit Ticket and have students reflect on and answer the prompt.