
Bell Ringer
Instructions: Select one of the Bell Ringers for students to reflect on and answer.
Vocabulary
Instructions: Go over important terms and their definitions before watching the Science of the Electric Grid video. The student vocabulary list can be found in the Student Guide and Science of the Electric Grid – Starter Pack.
| Word | Definition | Example |
|---|---|---|
| Electric Grid | noun phrase; a network of power plants, wires, and equipment that delivers electricity to homes and businesses | “One way to get electricity to people who don’t have it is to expand the electric grid.” |
| Generator | noun; a machine that converts mechanical energy into electrical energy | “[The first step is] building large generators to produce the electricity . . .” |
| Distribution System | noun phrase; the part of the electric grid that delivers electricity from substations to homes, schools, and businesses, with built-in redundancy (multiple pathways) that allows power to be rerouted to reduce service outages | “ . . . building the grid itself, [and] then building a distribution system to get power to the people who need it.” |
| Rural | adjective; related to the countryside, or areas outside of cities and large towns | “[Expanding the grid is] expensive in rural areas where the grid may have to cross miles of countryside to reach few customers.” |
| Utility Company | noun phrase; a company that delivers essential services like electricity to homes and businesses | “Figuring out how customers will get the electricity and how they will pay for it, so that the utility company can afford to deliver it, are ongoing challenges.” |
| Credits | noun; prepaid amounts that can be used to pay for electricity or other services | “Today, new electricity customers are paying with cell phones or buying credits at shops.” |
| Cartels | noun; organized groups that control illegal activity, such as stealing electricity or blocking service | “Utility companies sometimes have to fight local cartels who may try to steal power from the new lines.” |
| Centralized | adjective; controlled by a single authority or located in one main place | “Most of [the people who live in cities] will get their power from centralized generators connected to an electric grid.” |
| Off-Grid | adjective; not connected to a main electricity network | “ . . . the large majority of off-grid citizens are rural.” |
| Developing Nations | noun phrase; countries that are still building their economies and infrastructure | “In developing nations, stringing power lines in the rural areas is expensive, and there are often very few customers . . .” |
| Self-Contained Systems | noun phrase; energy systems that operate independently and do not need outside support | “This has allowed companies to start selling small self-contained systems to rural customers.” |
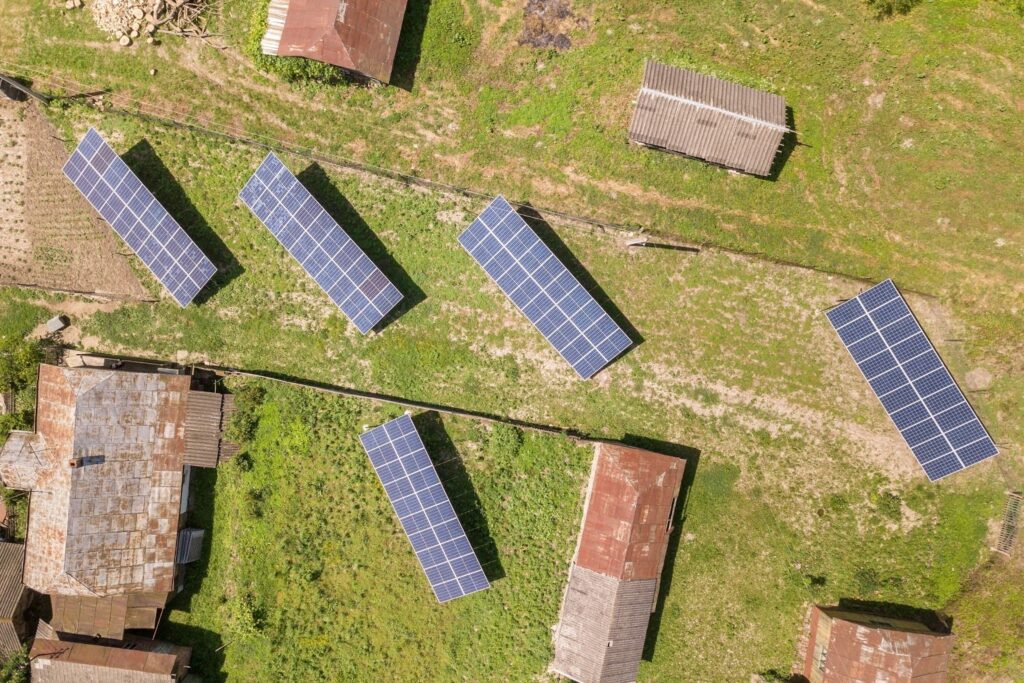
| Solar Arrays | noun phrase; groups of solar panels that work together to produce electricity | “Off-grid villages are taking this one step further, building small solar arrays.” |
| Microgrids | noun; small, local energy networks that can work with or without the main electric grid | “These are connected to local microgrids, and often to a large battery to provide on-demand electricity to connected homes and buildings.” |
| Private Companies | noun phrase; businesses owned by individuals or groups, not the government | “These so-called solar micro-grids are being built by private companies, public utilities, and nonprofits.” |
| Public Utilities | noun phrase; government-owned companies that provide services like electricity or water | “These so-called solar micro-grids are being built by private companies, public utilities, and nonprofits.” |
| Nonprofits | noun; organizations that use their money to support a cause instead of making a profit for their owners and shareholders | “These so-called solar micro-grids are being built by private companies, public utilities, and nonprofits.” |
| Developed World | noun phrase; countries with strong economies and advanced infrastructure | “[Off-grid systems] may not provide the scale of electricity consumed in the developed world . . . but are introducing millions of people to [energy’s benefits]. |
Quiz
Instructions: Review key concepts after watching the Science of the Electric Grid video. The Student Guide and Science of the Electric Grid – Starter Pack contain the quiz.
Answer Key: Q1:B Q2:C Q3:A Q4:D Q5:B Q6:D Q7:C Q8:B
Reading and Extended Reading
Instructions: Provide students with the Science of the Electric Grid – Reading or Extended Reading info sheet for an in-depth exploration of the topic.
Reading Answer Key:
- It’s the system that carries electricity from power plants to homes and businesses.
- Generation, transmission, and distribution.
- Electricity is made from energy sources like fuel, wind, or sunlight.
- They carry electricity long distances and keep energy loss low.
- A transformer changes the voltage to make electricity safe and efficient to use.
- A system that makes and uses its own power without the main grid.
- They may live far from power lines or want energy independence.
- Examples: old equipment, bad weather, high demand, renewable energy challenges, or cybersecurity threats.
- By using sensors and computers to detect and fix problems quickly.
- To keep electricity reliable, protect the environment, and make sure everyone has access to power.
Extended Reading Answer Key:
- Generation, transmission, and distribution.
- The grid enables electricity to be produced in central locations and distributed widely, making energy more reliable and affordable.
- Transformers increase or decrease voltage to allow efficient transmission and safe use of electricity.
- High voltage reduces energy loss due to resistance in transmission lines.
- An off-grid system operates independently from the main power grid, usually using local energy sources and storage.
- Wind and solar energy are connected to the grid through inverters and control systems that synchronize power from variable sources.
- Off-grid systems are useful in remote areas where connecting to the main grid is too costly or impractical.
- Grid operators use sensors, forecasting, and control systems to adjust power generation and keep supply equal to demand.
- When sunlight hits certain materials, it knocks electrons loose, creating an electric current, which is a process called the photoelectric effect.
- Countries connect grids to share resources, stabilize supply, and trade electricity when one area has excess generation.
- Grid-connected systems provide stable power and can share electricity, but depend on the larger network. Off-grid systems offer independence but may be limited by storage or weather.
- Yes, because it involves millions of interconnected components that must operate in real time across huge distances; others might say no because smaller systems are becoming more common.
- Challenges include aging infrastructure, cyber threats, renewable variability, and weather impacts; solutions include upgrading systems, smart technology, and storage.
- Smart grids use sensors and automation to detect outages, balance loads, and integrate renewables efficiently.
- Microgrids or off-grid systems can power hospitals, communication centers, or shelters independently, maintaining critical operations during outages.
Computation
Instructions: Provide students with the Science of the Electric Grid – Computation activity for math integration and practice.
Solar Microgrid Math Challenge
Imagine you are an engineer working with a rural village that isn’t connected to the main electric grid. Instead, the village relies on a solar microgrid made up of multiple solar panels and a battery storage system. The community needs your help to calculate how much energy their system can produce and whether it will be enough to meet their daily electricity needs.
Here are the details:
- The microgrid has 40 solar panels.
- Each panel generates 300 watts of power at peak sunlight.
- The village receives an average of 5 hours of peak sunlight per day.
- The village’s daily electricity needs are 55 kilowatt-hours (kWh).
Key Formulas
- Total Power (W) = Number of Panels x Power per Panel (W)
- Energy Produced (kWh) = Total Power (kW) x Sunlight Hours
- 1 kW = 1,000 W
Answer Key: Q1: 40 panels x 300W = 12,000W
Q2: 12,000W = 12kW; 12kW x 5 hours = 60kWh
Q3: Yes. The microgrid produces 60kWh per day, which is 5kWh more than the village needs (55kWh per day).
Q4: Step 1: Find the Energy Shortfall: 75kWh (needed) – 60kWh (produced) = 15kWh
Step 2: Find Daily Energy Produced by One Panel: 300W x 0.3kW; 0.3kW x 5h = 1.5kWh/day
Step 3: Divide Shortfall by Energy per Panel: 15kWh/1.5kWh = 10 panels
Data Set
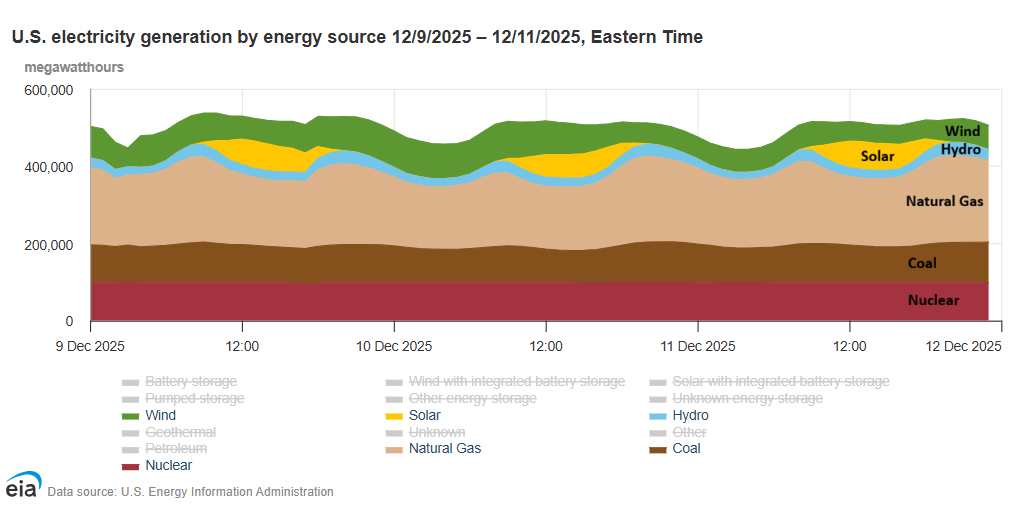
Instructions: Provide students with the Science of the Electric Grid – Data Set for data literacy and analysis practice. Note: Source link provided for further information and reference: U.S. Electricity Overview
Answer Key: (Answers will vary: Key ideas included)
Question 1: Greatest variability: Solar (large daily swings; zero at night); Wind (changes with weather partners and wind speed); Solar and wind depend on weather and time of day, so their output naturally fluctuates. Medium variability: Natural gas and Hydro (rises and falls to match changing demand). Natural gas plants can ramp up and down quickly, making them “flexible” and well-suited to fill gaps. Hydro is dispatchable to a degree; operators can adjust water flow through turbines, but it is still constrained by limits like river flow and reservoir rates. Most constant (steady baseline generation): Nuclear and Coal; Nuclear and coal plants are designed to run continuously at stable levels. They operate best at steady output and are not typically adjusted hour to hour.
Question 2: Operators must ensure other power sources are available early in the morning before solar ramps up and in the evening when solar rapidly drops (the “duck curve” problem). They need sufficient flexible backup generation, such as natural gas or hydropower, to fill in during non-sunlight hours. Increased solar may require energy storage, demand shifting, or improved forecasting to manage the steep rises and drops. Solar’s predictable daily pattern helps planning, but its variability still requires careful coordination.
Question 3: When wind production rises, natural gas generation often decreases, meaning gas plants reduce output because wind is providing more electricity. When wind drops, natural gas ramps up, covering the shortfall. This shows that natural gas plants act as a balancing or “dispatchable” resource, filling in the gaps left by variable wind output. It also shows how fossil-fuel plants currently provide the flexibility needed to integrate more renewable energy into the grid.
Question 4: Large-scale battery storage would smooth out the ups and downs in natural gas production. Batteries could store excess renewable energy and release it when solar or wind drop, reducing the need for natural gas to ramp up quickly. As a result, natural gas would show fewer spikes, and overall usage might decrease.
Question 5: Times of peak electricity demand; how quickly different sources ramp up or down (solar in the evening, wind changes, etc.); which sources are predictable and which are variable; availability of flexible generation (like natural gas); patterns of renewable production and when backup power will be needed; potential mismatches between supply and demand; forecastable trends (daily solar cycles, expected wind patterns); forecastable trends (daily solar cycles, expected wind patterns).
Question 6: The graph shows constant movement, with some sources rising while others fall. Demand fluctuates hourly, and renewable output is not perfectly aligned with these changes. Operators must continuously adjust which plants are running to keep supply exactly equal to demand every moment. Renewable variability means the system must have fast, flexible resources ready to respond. The need to coordinate many sources with different behaviors (steady, variable, ramping) highlights the complexity of maintaining a stable, reliable grid.
Microgrids Case Study Project
Instructions: Use the Microgrids Case Study Project – Student Handout and the following Teacher Guide to conduct the activity.
Introduction
This lesson introduces students to microgrids and highlights their role in improving energy reliability, resilience, and access, especially in regions affected by natural disasters or located far from major power lines. Students begin with a real-world Puerto Rico microgrid case study. Afterwards, based on teacher discretion and time allowance, students will complete either one or both of the following deeper learning pathways: a Research Project or a Debate Activity.
Student Objectives
Students will be able to
- Describe how microgrids and main power grids operate, and explain their key differences.
- Evaluate the benefits and limitations of different energy systems, including reliability, cost, sustainability, and resilience.
- Interpret real-world data to draw conclusions about energy needs and systems performance.
- Construct evidence-based explanations or arguments about energy infrastructure choices.
- Analyze how environmental conditions, natural disasters, and geography impact energy access.
- Reflect on how energy systems affect community resilience and quality of life.
Materials
- Student Handout
- Internet access for research
Part 1: Case Study Introduction
- Warm Up: Optional:
- Ask: What is a microgrid?
- Have students write individual ideas, then share.
- Give the class definition: A microgrid is a local, small-scale energy system that can operate independently or alongside the main power grid. It generates, stores, and distributes electricity to a specific area—like a campus, neighborhood, or town—using sources such as solar panels, wind turbines, batteries, and sometimes generators.
- Case Study Reading
- Students read Part 1: Puerto Rico Microgrid Case Study in the Student Handout, individually, or in pairs.
- Students answer the provided questions in the Student Handout.
- Class Discussion
- Facilitate discussion using prompts mirrored in the Student Handout.
- What is a microgrid? What kinds of energy sources are ideal for microgrids?
- Why are microgrids important for remote or disaster-prone areas?
- How does microgrid scale compare to the main grid?
- How might microgrids improve community resilience?
- Facilitate discussion using prompts mirrored in the Student Handout.
Part 2: Choose Learning Pathway(s) – Teacher Decision
You may choose one or both, depending on time and instructional goals.
Option A: Research Project
- Group formation: Assign students into groups of 2-3. Provide the Research Project section of the Student Handout.
- Task Instructions: Students choose two or three regions from the list provided and research the following, recording their findings in the chart and listing their sources.
- Current electricity delivery system
- Reliability
- Cost of electricity
- Resilience to disasters
- Improvement plan proposal
- Optional Deliverable: Short presentation, policy brief, or infographic.
Assessment Rubric
| Criteria | Proficient |
|---|---|
| Research Accuracy and Content Understanding | Accurately explains the current energy delivery system for each location; demonstrates strong understanding of grid/microgrid concepts and regional challenges |
| Evidence Use: Data, Sources, and Geographic Reasoning | Uses multiple credible sources; includes specific data (cost, outages, resilience metrics); clearly connects geographic factors (e.g., mountains, islands, climate) to energy access. |
| Improvement Plan Quality | Proposes realistic, well-reasoned improvements tied clearly to research and geography; addresses sustainability and resilience. |
Option B: Debate Activity
- Assign Debate Roles: Divide the class evenly into:
- Main Grid Advocates
- Microgrid Advocates
- Debate Research: Provide students (individually or in pairs) with the Debate Activity section of the Student Handout.
- Students defend their position in answer to the driving question: Should your community invest in expanding the main grid or develop more microgrids?
- Each student (or pair) is responsible for completing their own research of five features of the grid they’ve been assigned to (main grid or microgrid).
- Scale
- Reliability
- Cost
- Infrastructure
- Vulnerability
- Debate Preparation: Each individual or pair prepares the following sections of the debate.
- Opening statement
- 3-4 evidence-based arguments
- Counterarguments
- Closing Statement
- Debate Format: Students on the same “side” come together to share their debate preparation and the group decides which students are responsible for presenting each of the following debate sections below.
- Opening statements (2 minutes each)
- Main arguments (1-2 minutes per argument)
- Counterarguments (2-3 minutes)
- Closing Statements (1 minute each)
- Optional: Audience Q&A or Class Vote
- Individual Reflection: After the debate, students complete a short, written reflection on the question in the Student Handout.
Assessment Rubric
| Criteria | Advanced |
| Individual Assessment | |
| Research Quality | Research on all five features is thorough, accurate, and supported by multiple reputable sources; includes specific data, examples, and clear explanations linking grid type to real-world conditions |
| Debate Preparation | Prepares a clear opening idea, strong draft arguments with evidence, thoughtful potential counterarguments, and a focused closing point; materials show deep understanding and readiness for collaboration. |
| Post-Debate Reflection | Reflection is thoughtful, insightful, and connects learning to evidence, debate experience, and personal reasoning; clearly recommends a solution with justification. |
| Group Assessment | |
| Debate Presentation | Debate components are well-organized, clear, and persuasive; opening and closing are strong; arguments include relevant evidence; group transitions smoothly between speakers |
| Collaboration and Team Coordination | Group collaborates effectively; members share responsibilities; incorporates ideas from all students; shows strong teamwork during presentation |
Answer Key
Case Study Conclusion Questions Answer Key
1. The microgrids have about 75 kWh of battery storage.
75 kWh / 30 kWh per home per day = 2.5 homes
Each microgrid could power 2 average U.S. homes for one full day using only battery storage, with some energy left over.
2. Answers will vary. (Sample Student Response: 500,000 / 126.3 = 3,960.
A large power plant produces almost 4,000 times more power than all the microgrids combined.
This suggests that microgrids are not meant to replace large-scale generation, and instead serve local, targeted needs, especially during emergencies.)
3. Answers will vary. (Sample Student Response: Benefits of microgrids include providing power during major grid outages, supporting critical services such as medical clinics and food stores, and improving resilience in rural or mountainous areas. Limitations include limited battery storage and much smaller generation capacity than traditional plants, and high upfront installation costs.)
4. Answers will vary. (Sample Student Response: Impacts would include no refrigeration for food or medicine; no air conditioning or fans in hot weather; no phones, Internet, or TV; difficulty studying or working at night; unsafe conditions due to lack of lighting
Electricity affects nearly everything; transportation systems, healthcare, education, banking, food storage, and communication. Long-term outages would increase stress, economic hardship, and health risks.)
Research Project Key Ideas:
1. Nepal (Rural)
- System: Mix of main grid (Nepal Electricity Authority), widespread micro-hydropower, and solar microgrids in remote areas.
- Notes: Mountainous terrain makes grid expansion difficult; microgrids are vital in villages.
2. Bangladesh (Rural/Flood-prone)
- System: National grid, with over 5 million solar home systems in rural/off-grid areas.
- Notes: Solar is common where the grid is inaccessible or unreliable due to flooding.
3. Texas, USA (Rural)
- System: ERCOT main grid, some isolated co-op microgrids in remote areas.
- Notes: Severe weather can cause widespread outages; some communities are investing in local microgrids for resilience.
4. Philippines (Typhoon-prone islands)
- System: Main grid (Luzon-Visayas-Mindanao), diesel generators on remote islands, and some solar mini-grids.
- Notes: Many small islands lack reliable service; solar/diesel hybrids are common.
5. Haiti (Earthquake/Hurricane-prone)
- System: Limited national grid (EDH), most rely on diesel generators, solar home systems, or small microgrids.
- Notes: Grid is unreliable and covers only 25% of the population.
6. Kenya (Rural)
- System: Main grid (Kenya Power), but many rural areas use solar home systems, mini/microgrids.
- Notes: Solar companies like M-KOPA provide pay-as-you-go systems for off-grid homes.
7. Indonesia (Rural islands)
- System: National grid on major islands, diesel generators, and solar microgrids in remote islands.
- Notes: Geography makes grid expansion costly; the government is investing in solar mini-grids.
8. Alaska, USA (Remote)
- System: Isolated microgrids (mostly diesel-based) for most rural villages, some use wind/solar hybrids.
- Notes: No statewide grid; energy is expensive and vulnerable to fuel price spikes.
Exit Ticket
Instructions: Access the Exit Ticket and have students reflect on and answer the prompt.