

Introduction
Imagine using the Earth’s natural underground temperature to heat or cool buildings! Geothermal systems do just that. In this experiment, you’ll investigate how thermal energy moves between warm water and soil at different temperatures to model how geothermal heating and cooling systems work.
Procedure
Carefully follow the steps below to conduct the experiment.
Step 1: As a group, gather the materials provided by your teacher.
- 2 clear containers filled with soil (one chilled in the refrigerator overnight, one at room temperature)
- 2 resealable small plastic ziploc bags
- 2 liquid crystal thermal temperature strips
- 2 measuring cups or beakers
- 1 cup of warm water (~40-45°C)
- Warm tap water if available or heated with a kettle
- 2 pipette droppers (or other tool to drip water slowly)
- Timer or stopwatch
Step 2: Set up your thermal bags.
- Stick a thermal strip inside each ziploc bag.
- Press it flat and seal the bag, pushing out as much air as possible.
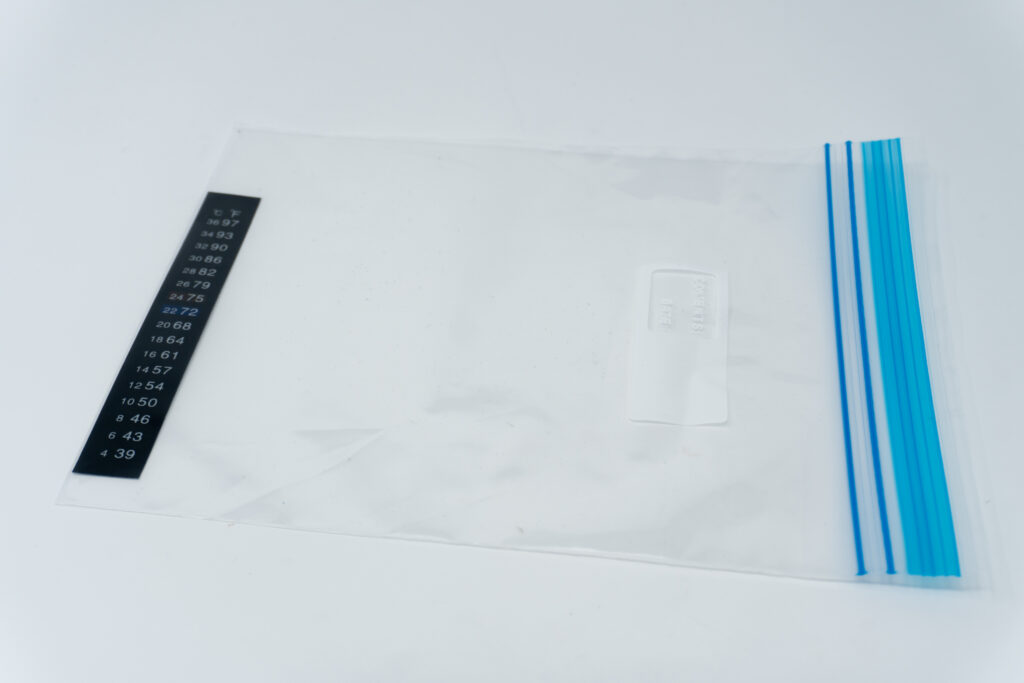
Step 3: Place bags in soil.
- In each container, make a shallow area in the soil by one wall of the container (~2-3 cm deep).
- Place one sealed bag flat against the inside wall of each container, so that the strip is visible through the container wall.
- Cover the ziploc bag with displaced soil, but make sure that the strip is visible through the container wall.
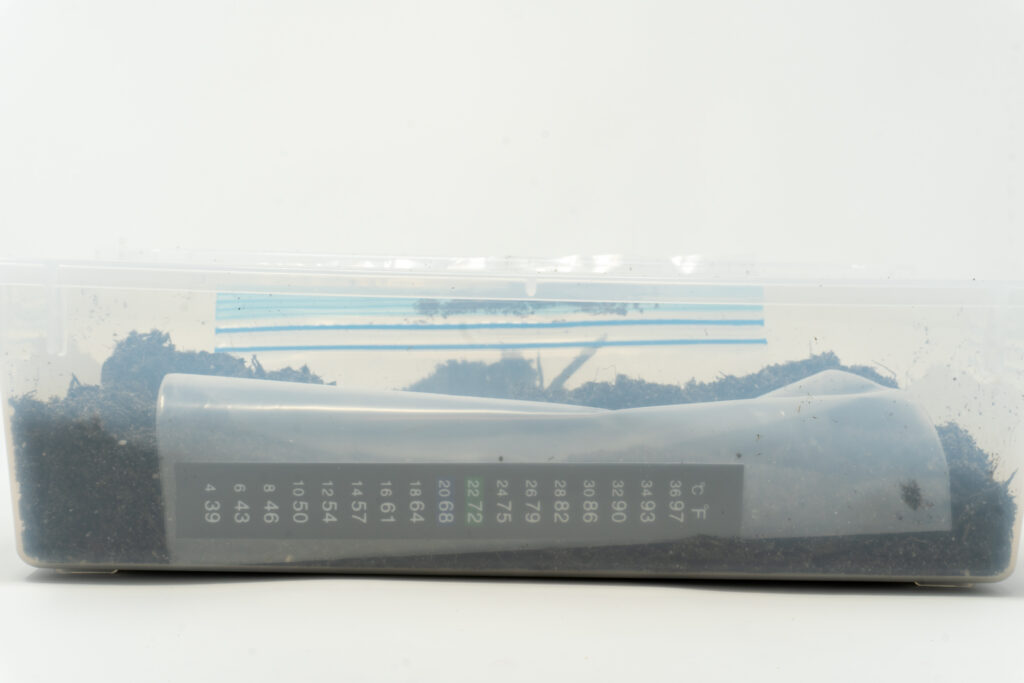
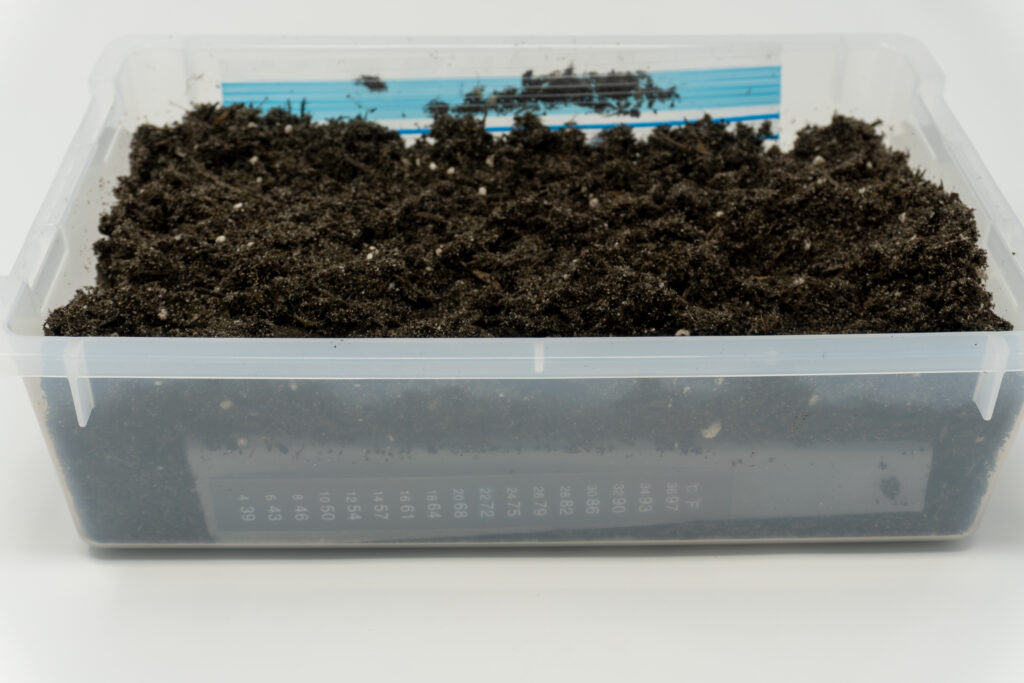
Step 4: Prepare the warm water.
- Pour ½ cup (120 mL) of warm water into each beaker.
Step 5: Add the warm water.
- Using a pipette, slowly drip the warm water over the area above the ziplock bag in each container. Try to add the water at a steady rate to model the flow of water through a geothermal pipe.
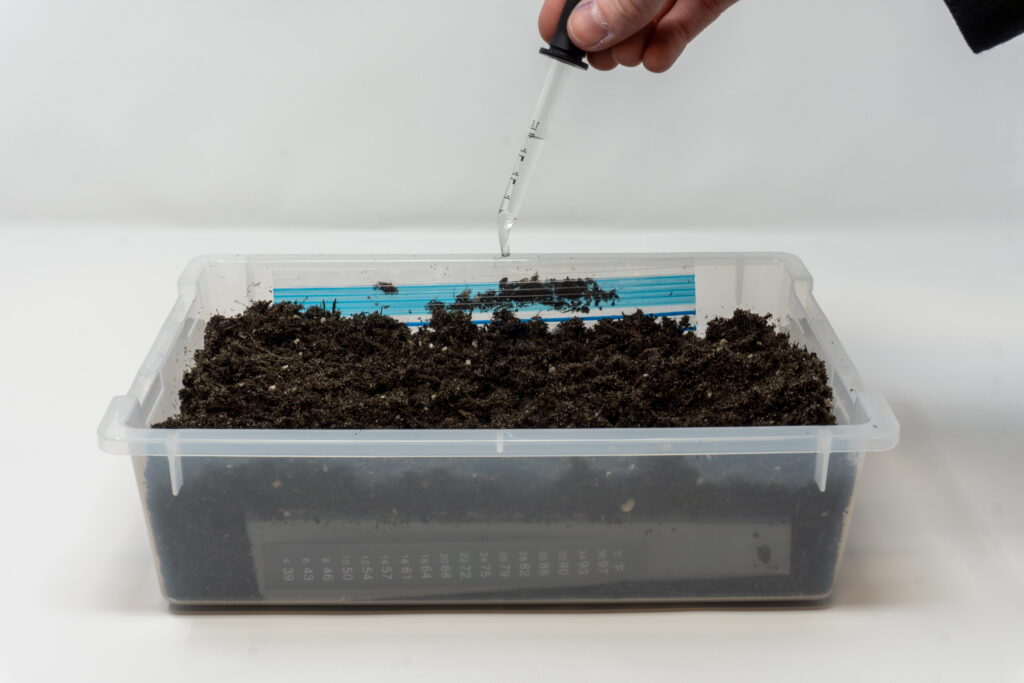
Step 6: Observe and record.
- Use the timer to check the thermal strips every 30 seconds for 5 minutes.
- Record the temperatures in the observation data table below.
Observation Data Table
| Chilled Soil | Room Temperature Soil | ||
| Starting Temperature | Starting Temperature | ||
| 0.5 minute | 0.5 minute | ||
| 1 minute | 1 minute | ||
| 1.5 minutes | 1.5 minutes | ||
| 2 minutes | 2 minutes | ||
| 2.5 minutes | 2.5 minutes | ||
| 3 minutes | 3 minutes | ||
| 3.5 minutes | 3.5 minutes | ||
| 4 minutes | 4 minutes | ||
| 4.5 minutes | 4.5 minutes | ||
| 5 minutes | 5 minutes | ||
Graph Your Results
Using graph paper or an online graphing tool, create a line graph using the temperature data you collected from both containers.
Graph Setup
- Graph Title: Temperature Change in Soil Over Time
- X-axis: Time (minutes)
- Y-axis: Temperature (°C)
- Plot both containers on the same graph using different colors or symbols.
- Include a legend identifying each container (chilled soil and room temperature soil).
Analyze Your Graph
Look at the shape of each line before answering the reflection questions. A steeper line means the temperature changed at a faster rate.
Reflection Questions
1. Calculate the average rate of temperature change (°C per minute) for each container using the formula below. Show your work.
Average rate of temperature change = (Final temperature − Starting temperature) ÷ Total time
2. Using your graph and your calculations, which container’s temperature changed more quickly? What does this tell you about the movement of thermal energy between the warm water and the surrounding soil?
3. Use evidence from your experiment to explain how geothermal systems can help heat or cool buildings while using less electricity.