
Lab Question
How does the angle of a solar panel affect how much electricity it produces?
A. Identify the independent variable (what you change): ______________________________
B. Identify the dependent variable (what you measure): ______________________________
C. List the controlled variables (what you keep the same):
Hypothesis
After discussing the above question with your teammates, formulate a hypothesis (if/then statement). What do you think will happen?
Procedure
Gather the lab materials from your teacher and follow the steps to conduct the experiment.
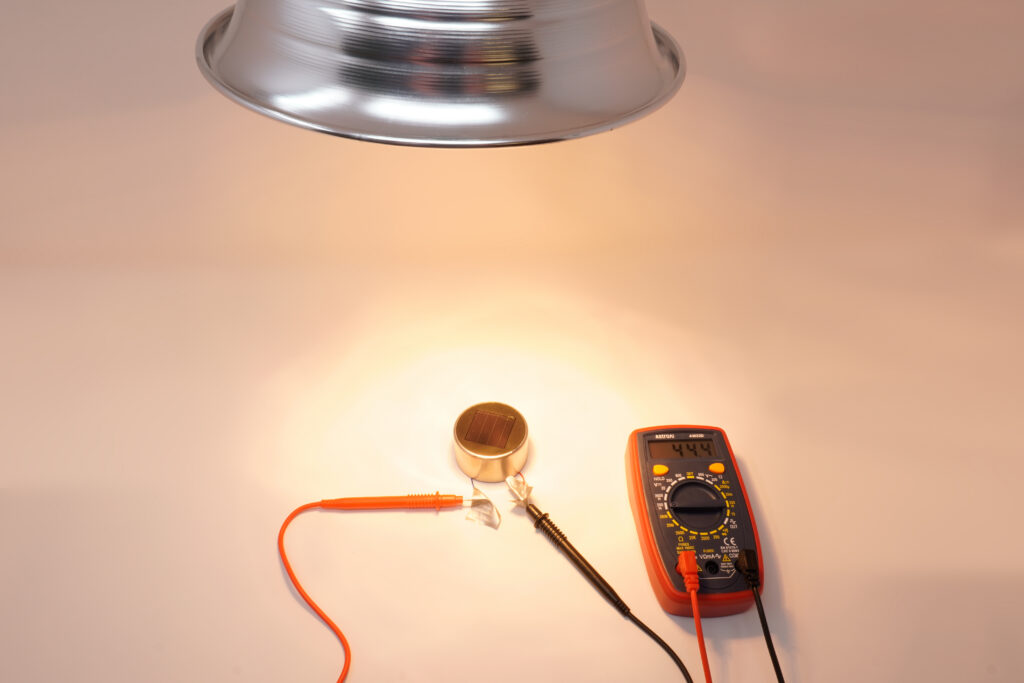
- Set Up: Place the solar panel at 0° (flat). If using a lamp, place the solar panel flat (0° relative to the surface) and position the lamp directly above it at a fixed distance (e.g., 30 cm).
- If using sunlight, place the panel on a flat surface (e.g., the ground or a sidewalk) and ensure it is in direct sunlight with no shade. Note: In this case, the sun’s angle will not be 0° and will vary based on location, time of day, and time of year. You will still adjust the panel’s tilt relative to the ground in subsequent steps.
- Connect the Multimeter: Turn on the lamp or ensure the panel is in full sunlight. Set the multimeter to DC voltage. Securely tape one probe to each exposed wire end.
- Voltage Measurement: If the voltage reading is very small, or shows “0.00” on the V setting, switch the multimeter to the millivolt (mV) setting.
- Calculate: If measuring in mV, divide the value by 1000 to convert to volts (V) before recording it on the data table.
- Record: Record voltage in volts (V) and current in amps (A) in the data tables.
- Adjust Angle: Using a protractor, adjust the panel to 15°, 30°, and 45°, measuring and recording voltage and current at each angle.
- Multiple Trials: Repeat measurements at each angle for at least three trials to improve accuracy and reliability. (Optional: Rotate the panel for other angles, e.g., 60°, if time allows.)
- Control Variables: Keep the intensity and distance of the light source constant throughout all trials.
- Average Data: Calculate the average voltage and average current for each angle.
Data Table (Voltage)
| Angle (°) | Trial 1 (V) | Trial 2 (V) | Trial 3 (V) | Avg (V) |
|---|---|---|---|---|
| 0 | ||||
| 15 | ||||
| 30 | ||||
| 45 |
Data Table (Current)
| Angle (°) | Trial 1 (A) | Trial 2 (A) | Trial 3 (A) | Avg (A) |
|---|---|---|---|---|
| 0 | ||||
| 15 | ||||
| 30 | ||||
| 45 |
The formula for power output (W) is Voltage (V) x Current (A).
Complete the data table below to compute the Power Output for each angle.
Data Table (Power Output)
| Angle (°) | Average Voltage (V) | Average Current (A) | Power Output (W) |
|---|---|---|---|
| 0 | |||
| 15 | |||
| 30 | |||
| 45 |
Graph Results
Plot power output (y-axis) versus angle (x-axis) for clear visualization of trends. Use graph paper provided by your teacher or a digital graphing tool.
Analysis Questions
- At which angle did your solar panel produce the highest average electricity output?
- How consistent were your results across trials?
- Why does the output change as the angle changes? (Relate to sunlight intensity and panel orientation.)
- How could your findings help someone planning to install solar panels at their home or business?
- What real-world factors (e.g., seasonal sun angle, roof design, weather) might affect solar panel output beyond what you tested in this lab?
Conclusion
- Did the data support your hypothesis? Explain.
- Based on the experiment, what factors have an impact on solar panel placement?
- How could you improve the experiment? What variables were challenging to control?