
Introduction
In this lab investigation, students will explore how the height of water affects flow rate and pressure, which are key principles behind how hydroelectric dams generate energy. Using a simple jug-and-tube setup, students will model how gravity and water movement can be harnessed to simulate real-world hydropower systems. Students will practice data collection, analysis, and applied scientific reasoning.
Student Objectives
Students will be able to
- Understand how water height influences flow rate and pressure.
- Measure and calculate the flow rate.
- Collect, record, and analyze experimental data.
- Apply scientific reasoning to real-world hydropower systems, such as dams and turbines.
Materials
- Box cutter (pre-lab for teacher)
(per student group)
- Student Handout
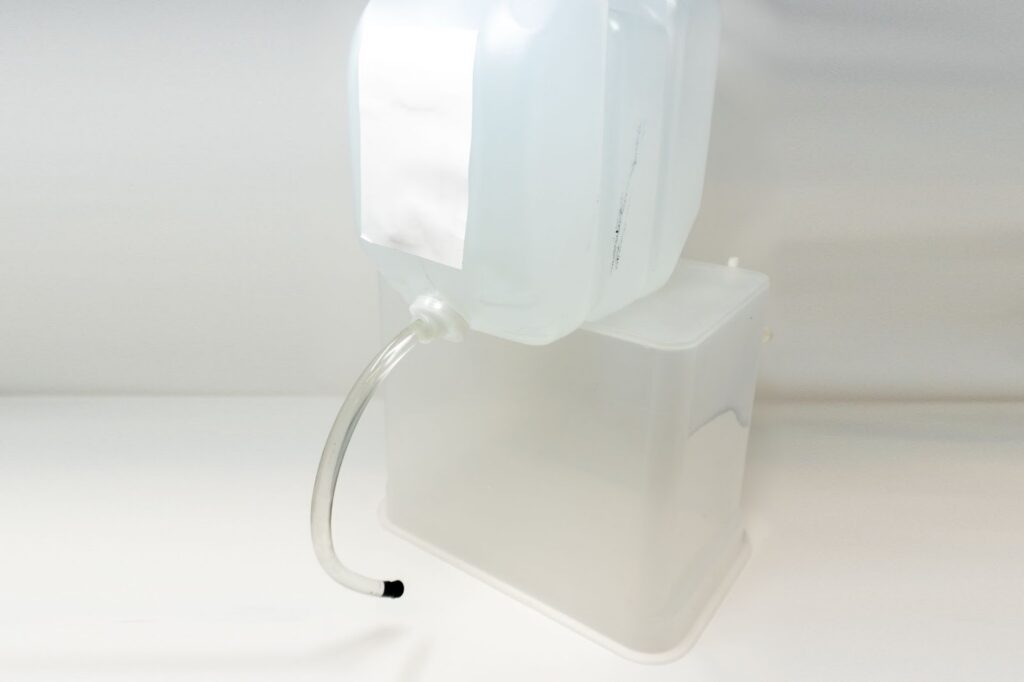
- Water jug with vent
- Example: 2.5 gallon water jug with vent
- Plastic tubing (~1 foot length)
- Example: ½”ID plastic tubing (diameter chosen can vary)
- Rubber stopper (needs to match the diameter of plastic tubing)
Example: 0# tapered rubber stopper - Glue gun
- Large container (to catch water from the jug)
- Large graduated cylinder or beaker (marked with mL/L) to measure water collected
- Stopwatch
- Ruler or measuring tape
- Permanent marker
Teacher Prep
(or supervised student group set-up)
- Using a box cutter, cut off the vent from the water jug.
- Insert the plastic tubing and seal with hot glue.
- Plug the other end of the plastic tubing with a rubber stopper.
- Using the permanent marker, mark the following levels on the jug: ¾ full, ½ full, ¼ full.
- Demonstrate the setup before students begin.
Procedure
- Divide the class into groups of 2-4 students.
- Provide each group with materials and the Student Handout.
- On the Student Handout is an Introduction and Research Question. Begin a class discussion on the goal of the investigation, leading to the formulation of a hypothesis.
- Assign roles before students begin the investigation: Timer, Recorder, Pourer, and Measurer.
- Instruct students to follow the instructions on the Student Handout to conduct the investigation.
- Remind students to use caution with water on floors to prevent slipping, and to clean up spills immediately.
- After completing the investigation, students will create a graph based on their collected data showing the relationship between flow rate and water height, and complete analysis and conclusion questions.
Answer Key
The Student Guide contains the Water Pressure and Flow Lab – Student questions
Analysis and Conclusion Questions
Question 1: (Example Response) As the water height increased, the flow rate also increased. This means that when the container was full, the water flowed out faster than when the container was only ¼ full. There is a clear positive relationship between water height and flow rate.
Question 2: Answers will vary based on the student’s specific hypothesis. (Example: Yes, my results supported my hypothesis. I predicted that the flow rate would increase with water height because more water above the tube means more pressure pushing the water out. The data showed that higher water levels consistently led to higher flow rates, confirming my hypothesis.)
Question 3: (Example Response) This model shows that the higher the water behind a dam, the more pressure it creates, which can spin turbines faster and generate more electricity. Just like in the experiment, gravity pulls the water down, and the more height (or potential energy) that it has, the more kinetic energy it can create when released.
Question 4: (Example Response) Engineers build tall dams to store more water to increase the potential energy of the water. A taller dam means the water can fall a greater distance, which increases the pressure and flow rate. This allows the turbines to spin faster and generate more electricity efficiently.
Question 5: Answers will vary based on the results of student trials. (Example: The results were mostly consistent but there were some small differences between trials. These differences could be caused by small timing errors when starting or stopping the stopwatch, or slight changes in how fast or slow the stopper was removed. Also, small leaks or bubbles in the tubing could affect the flow.
Question 6: Answers will vary. (Example: If the tubing was wider, I think the water would flow out faster because there’s more space for it to move through. If it was longer, the flow rate might slow down because there’s more resistance inside the tube. In real dams, engineers must design pipes and turbines to balance speed and pressure for maximum energy efficiency.)