
Data Table
| 2000 | 2005 | 2010 | 2015 | 2020 | 2023 | |
|---|---|---|---|---|---|---|
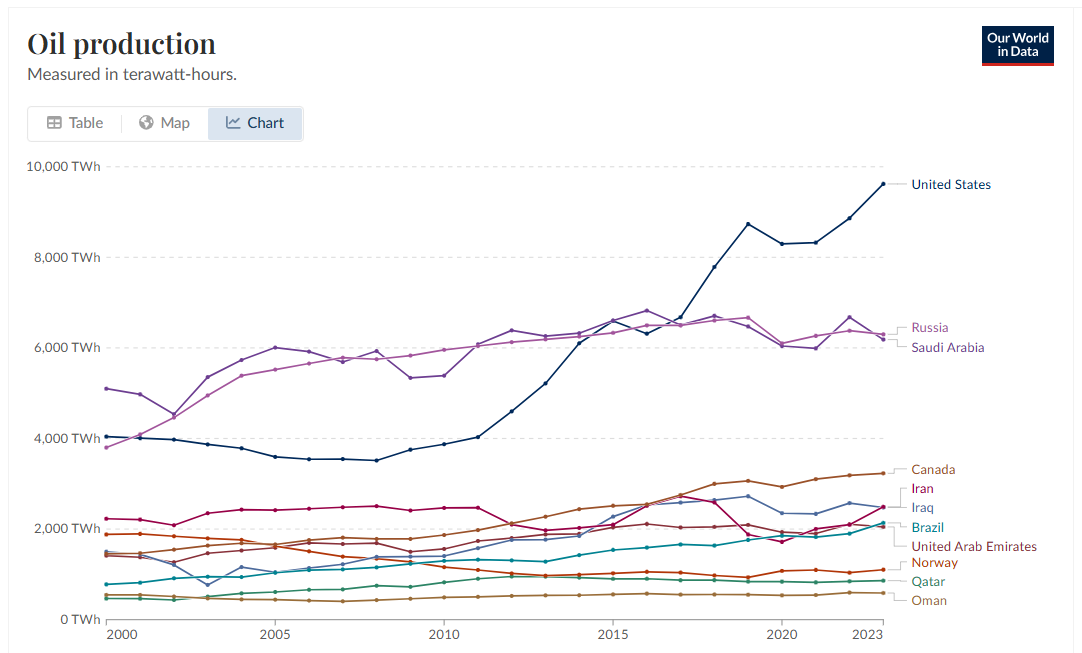
| United States | 4042 TWh | 3594 TWh | 3874 TWh | 6595 TWh | 8296 TWh | 9620 TWh |
| Russia | 3799 TWh | 5533 TWh | 5958 TWh | 6333 TWh | 6098 TWh | 6300 TWh |
| Saudi Arabia | 5100 TWh | 6008 TWh | 5388 TWh | 6606 TWh | 6043 TWh | 6183 TWh |
| Canada | 1455 TWh | 1659 TWh | 1868 TWh | 2513 TWh | 2931 TWh | 3231 TWh |
| Iran | 2229 TWh | 2418 TWh | 2466 TWh | 2096 TWh | 1717 TWh | 2492 TWh |
| Iraq | 1498 TWh | 1046 TWh | 1405 TWh | 2275 TWh | 2350 TWh | 2478 TWh |
| Brazil | 780 TWh | 1035 TWh | 1298 TWh | 1537 TWh | 1852 TWh | 2136 TWh |
| UAE | 1413 TWh | 1588 TWh | 1561 TWh | 2036 TWh | 1930 TWh | 2048 TWh |
| Norway | 1881 TWh | 1622 TWh | 1158 TWh | 1023 TWh | 1078 TWh | 1102 TWh |
| Qatar | 467 TWh | 611 TWh | 825 TWh | 900 TWh | 839 TWh | 862 TWh |
| Oman | 547 TWh | 442 TWh | 491 TWh | 559 TWh | 536 TWh | 588 TWh |
Instructions: Study the graph and data table above to answer the questions.
Question 1
Between 2010 and 2023, the United States’ oil production increased significantly. What factors – technological, economic, or political – might have contributed to this trend?
Question 2
Considering the rise in oil production in several countries, what environmental concerns might arise? How should countries balance energy needs with environmental responsibilities?
Question 3
How might high oil production benefit a country’s economy or international influence? What could be some challenges for countries that rely heavily on oil production?
Question 4
Countries like Norway and Qatar show relatively stable oil production. What might this suggest about their approach to energy production?
Question 5
If you were an energy advisor for one of these countries, what would you recommend they focus on for the next 20 years?