
Source: Our World In Data
Data Table
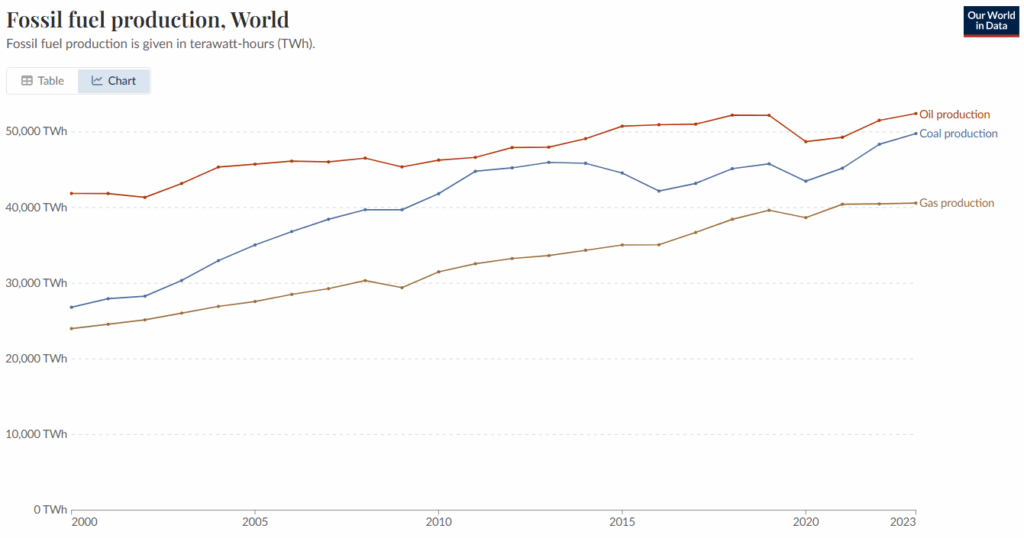
| 2000 | 2010 | 2020 | 2023 | |
|---|---|---|---|---|
| Oil Production (TWh) | 41,863.73 | 46,271.11 | 48,708.86 | 52,432.23 |
| Coal Production (TWh) | 26,812.19 | 41,834.36 | 43,483.91 | 49,789.16 |
| Gas Production (TWh) | 24,007.17 | 31,501.74 | 38,661.79 | 40,592.31 |
Instructions: Study the graph and data table above to answer the questions.
Question 1
Which fossil fuel showed the most consistent increase in production from 2000 to 2023, with the least amount of fluctuation? What do you think contributes to this consistency?
Question 2
Compare the total increase in TWh for coal, oil, and gas between 2000 and 2023. Which fuel had the largest absolute increase, and why might that be?
Question 3
If you were to extend the graph to the year 2030, what would you expect to see? Create your own projection for all three fuels and explain your reasoning.
Question 4
Compare natural gas production growth to oil and coal. What makes the trend for gas different or similar?
Question 5
For a country active in the production of natural gas, what types of infrastructure investments would be necessary to support the trend seen in gas production?