
Source: Our World In Data
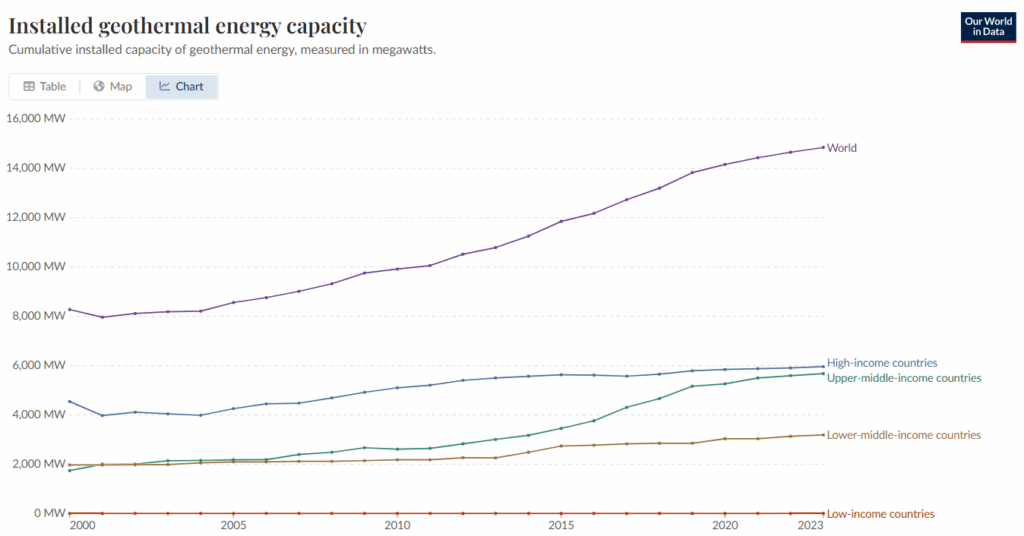
Data Table
| Region | 2000 (MW) | 2024 (MW) |
| High-income countries | 4543.20 | 5958.91 |
| Low-income countries | 7.30 | 7.30 |
| Lower-middle income countries | 1974.70 | 3190.34 |
| Upper-middle income countries | 1743.50 | 5674.89 |
| World | 8272.70 | 14845.94 |
Instructions: Study the graph and data table above to answer the questions.
Question 1
Describe the global trend in installed geothermal energy capacity from 2000 to 2023. Did all income groups follow the same trend? Use evidence from the graph to support your answer.
Question 2
What is the percent increase in global geothermal energy capacity from 2000 to 2023? Show your work and round your answer to the nearest hundredth. Hint: Find the difference between 2000 and 2023 energy capacity, and then divide by the 2023 total.
Question 3
Which income group has contributed the most to the global increase in installed geothermal capacity over the time period shown in the graph? Explain your reasoning using evidence from the data.
Question 4
Why might low-income countries have limited growth in geothermal energy use? Support your answer with reasoning or evidence from the graph.
Question 5
Create a question from the data set and then answer it.
My Question:
My Answer: