
Data centers are large buildings filled with servers that work together like a giant computer, forming a distributed system made up of many connected components. These components perform three main functions: networking (communicating with other computers), storage, and processing. Every time you stream a video, search online, or use AI, your request is handled by one or more data centers working together. These facilities require large amounts of electricity not only to run the equipment, but also to keep them cool and operating efficiently.
In 2024, data centers used about 415 terawatt-hours (TWh) of electricity, or roughly 1.5% of global electricity use. By 2030, this number is expected to more than double to around 945 TWh. A major reason for this growth is the rise of artificial intelligence (AI), which relies on accelerated servers—more powerful and energy-intensive computers designed for complex tasks.
Global Data Center Electricity Consumption, by Equipment
Base Case, 2020-2030
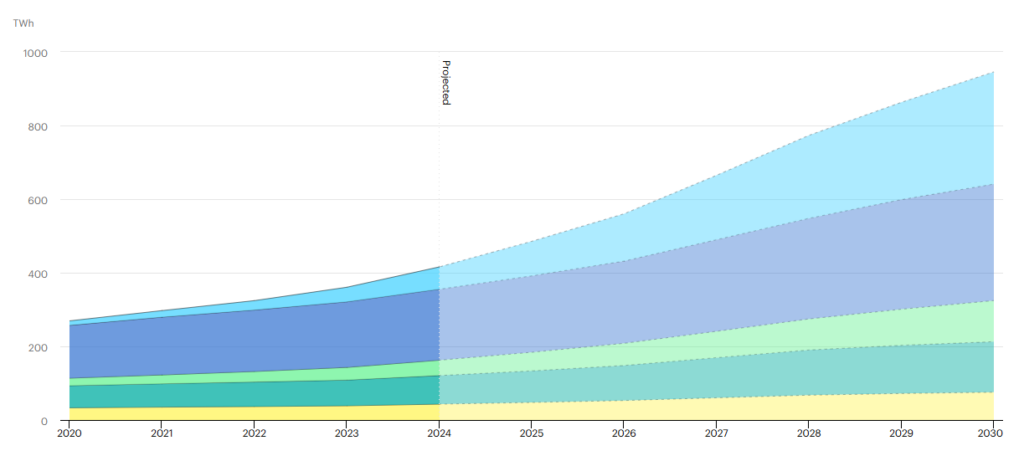

Source: IEA
Instructions: Read the text and study the graphs to answer the questions.
Question 1: Describe the trend in global data center electricity use from 2020 to 2024.
Question 2: The graph includes both measured data and projected (predicted) data. Around what year does the graph shift from past data to projections, and how can you tell?
Question 3: How does the rate of growth in data center electricity use change before and after this point? What might explain the difference?
Global Data Center Electricity Consumption in Server Stock and Server Capacity, 2020-2030
Server stock refers to the number of servers, while server capacity refers to how much computing power they provide.
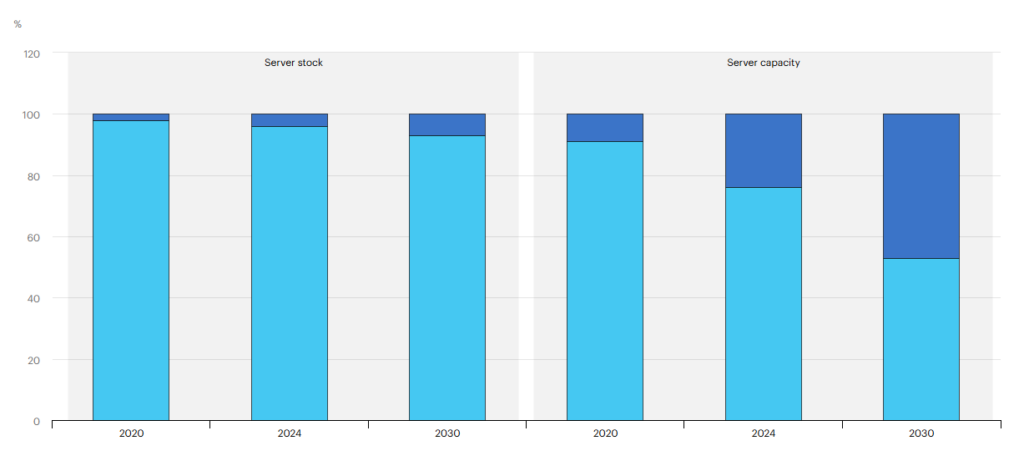

Source: IEA
Question 4: How do server stock and server capacity change from 2020 to 2024? How are they predicted to change from 2024 to 2030? Which increases more quickly?
Question 5: How does the growth of accelerated servers compare to conventional servers? What can you infer about how computing needs are changing?
Question 6: Based on both graphs, is the increase in energy use more closely related to the number of servers or the type of servers being used? Support your answer with evidence from the graph.
Question 7: Based on the graphs, what do the trends suggest about how AI is affecting data center energy use?
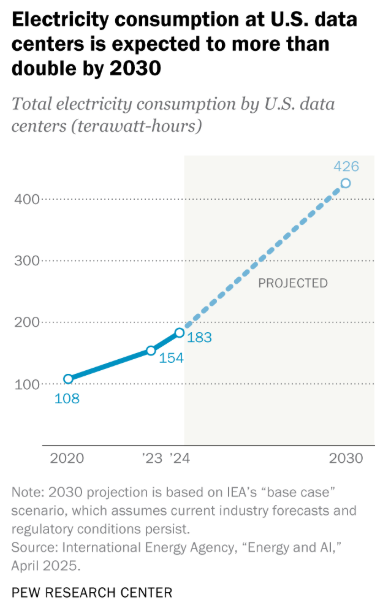
The United States accounts for the largest share of global data center capacity, making it an important case study for understanding how these facilities affect energy use and infrastructure.
In 2024, U.S. data centers used about 183 terawatt-hours (TWh) of electricity—more than 4% of the country’s total electricity use. As shown in the graph, electricity use has been increasing steadily and is projected to more than double to about 426 TWh by 2030.
AI is a major reason for this growth. A typical AI-focused data center can use as much electricity as 100,000 homes, and some newer facilities are expected to use much more.
Because multiple data centers are often built in the same region, they can put significant pressure on local power systems. In some states, data centers already use a large share of electricity—for example, about 26% in Virginia and over 10% in several other states.
Source: Pew Research Center
Question 8: By how many terawatt-hours (TWh) is electricity use expected to increase from 2024 to 2030? What does this change suggest about future electricity demand?
Question 9: How does AI contribute to the increase in data center electricity use? Use evidence from the reading to support your answer.
Question 10: What does the Pew Research Center say about how data centers are distributed geographically? How might high electricity use in one area affect local power systems or communities?