
Source: Our World In Data
Data Table
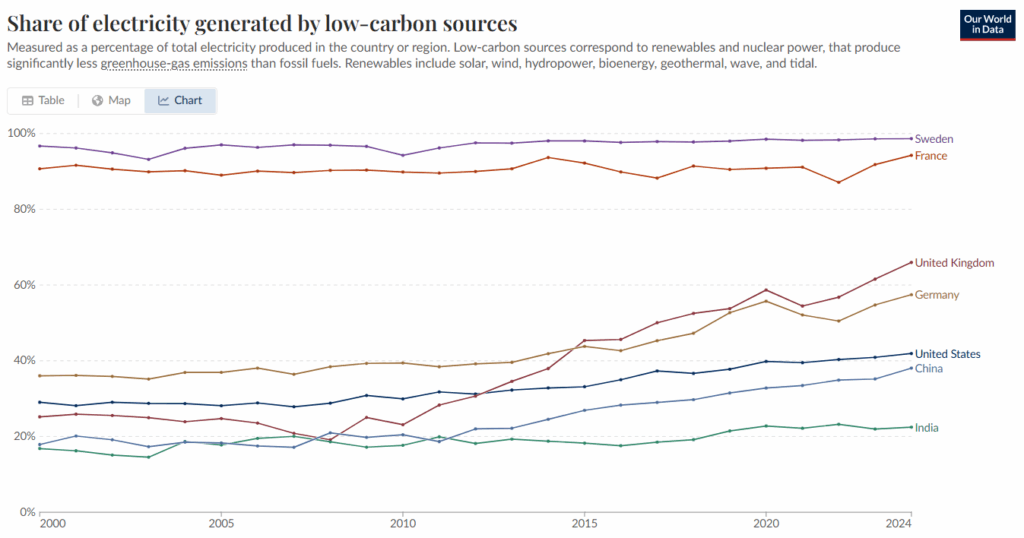
| Country | Share (%) 2000 | Share (%) 2024 |
| China | 17.87 | 38.06 |
| France | 90.69 | 94.25 |
| Germany | 36.03 | 57.45 |
| India | 16.81 | 22.46 |
| Sweden | 96.72 | 98.65 |
| United Kingdom | 25.19 | 65.99 |
| United States | 29.06 | 41.92 |
Instructions: Study the graph and data table above to answer the questions.
Question 1
What do you notice about Sweden and France’s share of electricity generated by low-carbon sources from 2000 to 2024? How are their trends different from the other countries on the graph?
Question 2
Which country had the biggest increase in low-carbon electricity between 2000 and 2024? How do you know?
Question 3
Compare China and the United States in 2000 and 2024. Which country had more low-carbon electricity in 2024, and which country increased more over time?
Question 4
What factors do you think might have caused the big jump in low-carbon electricity in Germany and the UK after 2010?
Question 5
Create a question from the data set above and answer it.
My Question:
My Answer: