
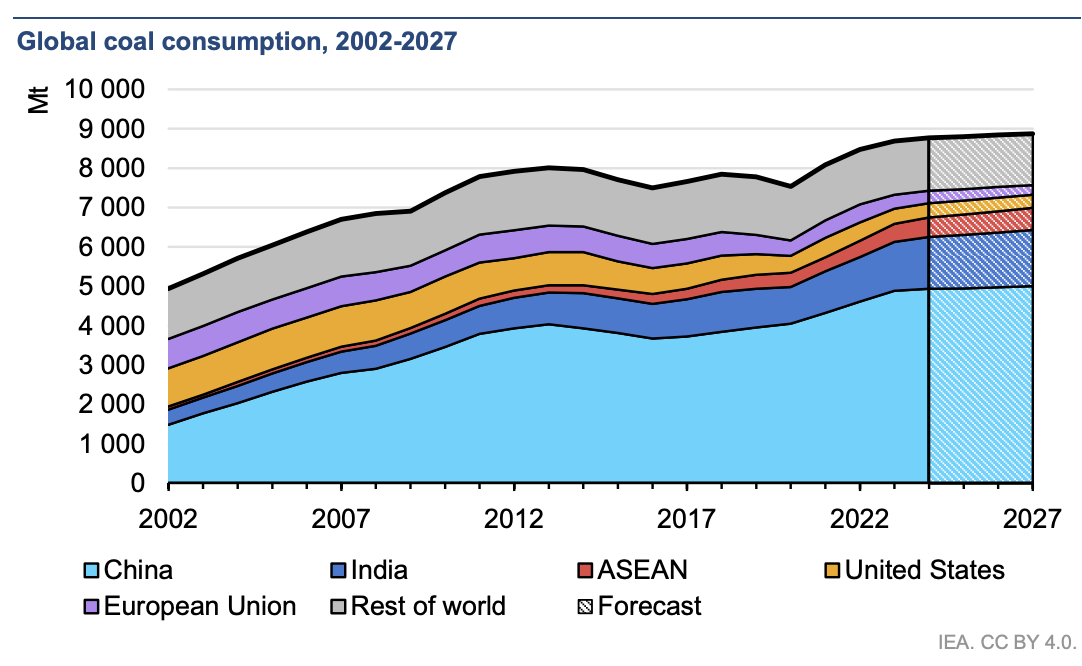
Data Table: Total Coal Consumption (Mt*), 2023-2027 (forecast)
| Region or Country | 2023 | 2024 | 2025 | 2026 | 2027 |
|---|---|---|---|---|---|
| China | 4883 | 4939 | 4940 | 4970 | 5005 |
| India | 1245 | 1315 | 1363 | 1392 | 1422 |
| ASEAN | 457 | 491 | 520 | 544 | 567 |
| United States | 386 | 368 | 351 | 343 | 331 |
| European Union | 354 | 312 | 293 | 273 | 244 |
| Rest of World | 1362 | 1346 | 1334 | 1325 | 1304 |
| World | 8687 | 8771 | 8801 | 8847 | 8873 |
Source: IEA; *[Mt represents megatonne or million metric tons = 1 x 10⁹ kg]
Instructions: Study the graph and data table above to answer the computational questions.
Q1: Using the data provided, calculate the percentage increase in coal consumption for China and for India from 2023 to 2024. Show your calculations for each country.
Q2: ASEAN refers to the Association of Southeast Asian Nations, a group of 10 countries that includes Indonesia, Vietnam, Thailand, Singapore, Malaysia and others. Using the data provided, calculate the percentage growth in coal consumption for ASEAN from 2023 to 2024.
Q3: Using the data provided, calculate ASEAN’s share of global coal consumption in 2023 and in 2027. How does this share change over the period? Show your calculations.
Q4: In 2024, the populations were:
China – 1.409 billion
India – 1.451 billion
U.S. – 340.1 million
What was the per capita coal consumption in each of these countries? Report your answer in kg/person. (Note: Mt = 1 million metric tons; 1 metric ton = 1000 kg)
Q5: Using the table, calculate the percentage change in coal consumption from 2023 to 2027 for each country or region.
Then identify:
A. the country/region with the largest percentage increase, and
B. the country/region with the largest percentage decrease.
Show your calculations and cite the values you used from the table. (round to 0.1%)
Q6: Using the data provided, calculate the net change in global coal consumption from 2023 to 2027. State whether this change is an increase or decrease, and give your answer in megatonnes (Mt).