
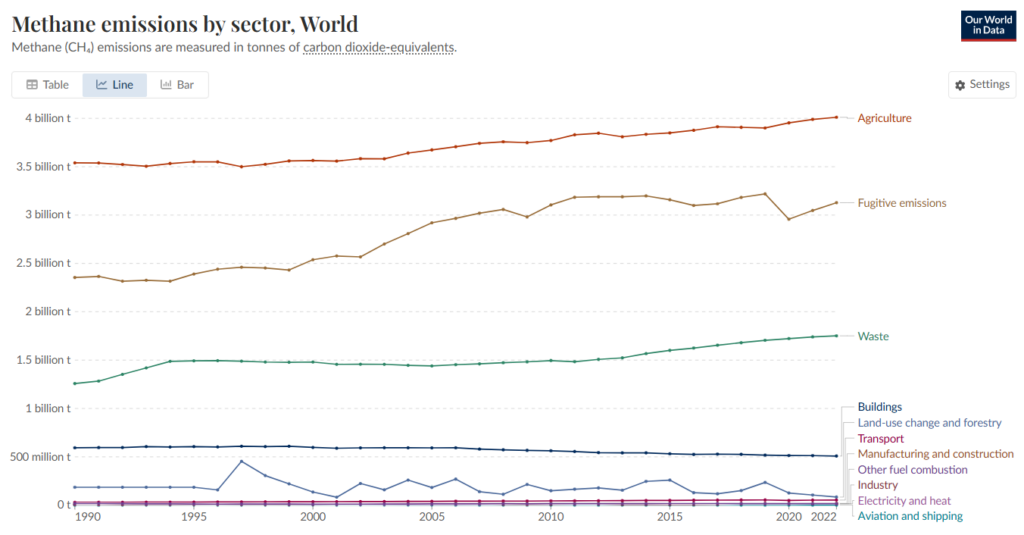
“Fugitive emissions” represent the unintentional gas leaks from processes such as hydraulic fracturing and more traditional oil and gas extraction and transportation. This can happen when gas is transported through poorly maintained pipes, for example.
Source: Our World In Data
Instructions: Study the graph and information below to answer the questions.
Question 1
Between 1990 and 2022, describe the trend in fugitive emissions shown on the graph. Use the chart to estimate the approximate change in fugitive emissions (in tonnes CO2-eq) from 1990 to 2022.
Question 2
Fugitive emissions are often linked to leaks from oil and gas production and transportation. Based on the graph’s trend, propose two plausible policy or engineering actions that could reduce fugitive emissions, and briefly explain how each action could affect the trend.
Question 3
Between 1990 and 2022, which two sectors show the largest increase in emissions? For each sector, describe the trend.
Question 4
Estimate the change in emissions from the “Waste” sector between 1990 and 2022 (increase, decrease, or roughly the same). Explain how you read this from the graph, and give a rough numeric estimate (e.g., “about X million tonnes CO2-eq”).