
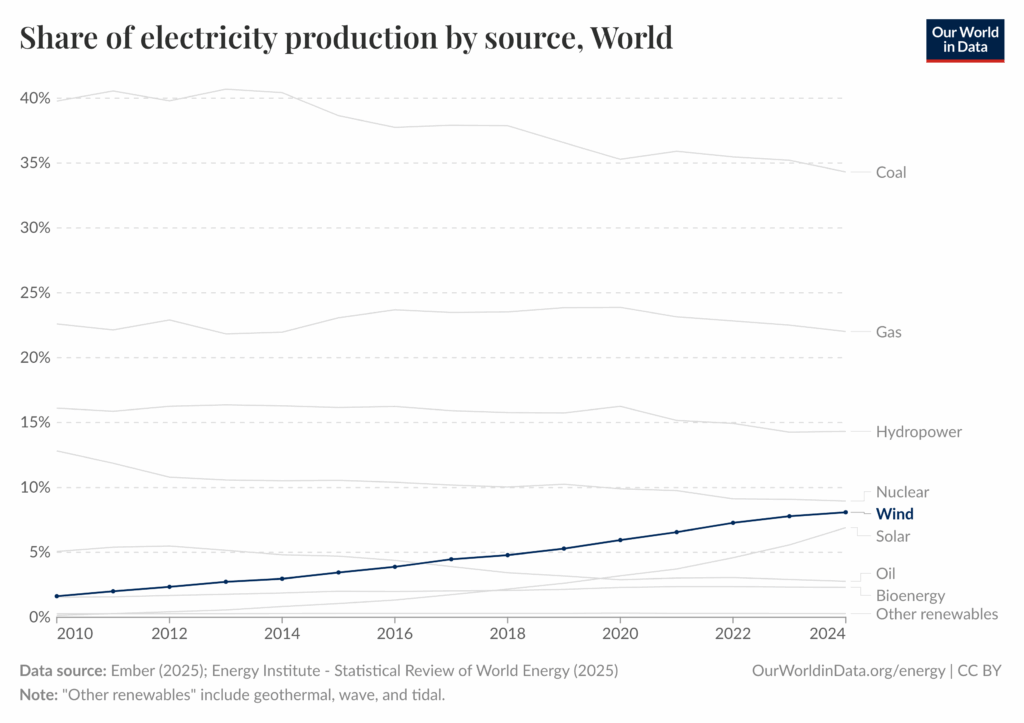
Note: “Gas” on the graph refers to natural gas
Data Table
| Year | Wind Energy Generation (TWh) | Year | Wind Energy Generation (TWh |
|---|---|---|---|
| 2010 | 345.92 | 2017 | 1138.96 |
| 2011 | 439.88 | 2018 | 1267.89 |
| 2012 | 529.18 | 2019 | 1419.80 |
| 2013 | 634.05 | 2020 | 1590.68 |
| 2014 | 706.01 | 2021 | 1849.47 |
| 2015 | 829.57 | 2022 | 2098.52 |
| 2016 | 960.00 | 2023 | 2304.44 |
Instructions: Use the graph and table above to answer the computational questions below.
Q1. Global wind generation and total electricity generation, measured in TWh (terawatt-hours), have grown significantly in the past decade. Calculate the average annual increase in wind energy generation from 2010-2023. Round your answer to the nearest hundredth. Hint: Average annual increase = (Final value – Initial value) / Number of years
Q2. Between which two consecutive years did wind energy generation increase the most (in terawatt-hours)?
Q3. Total electricity production in 2023 was 29,429.05 TWh. What percentage of global electricity was generated by wind in 2023? Round your answer to the nearest hundredth.
Q4. Assuming the average annual increase from 2010 to 2023 continues at the same rate, estimate the wind energy generation in 2025. Hint: Use the average annual growth from Question 1.
Q5. Global wind power generation has grown significantly in recent years. What are three possible reasons for this increase?