
Source: Our World In Data
Data Table
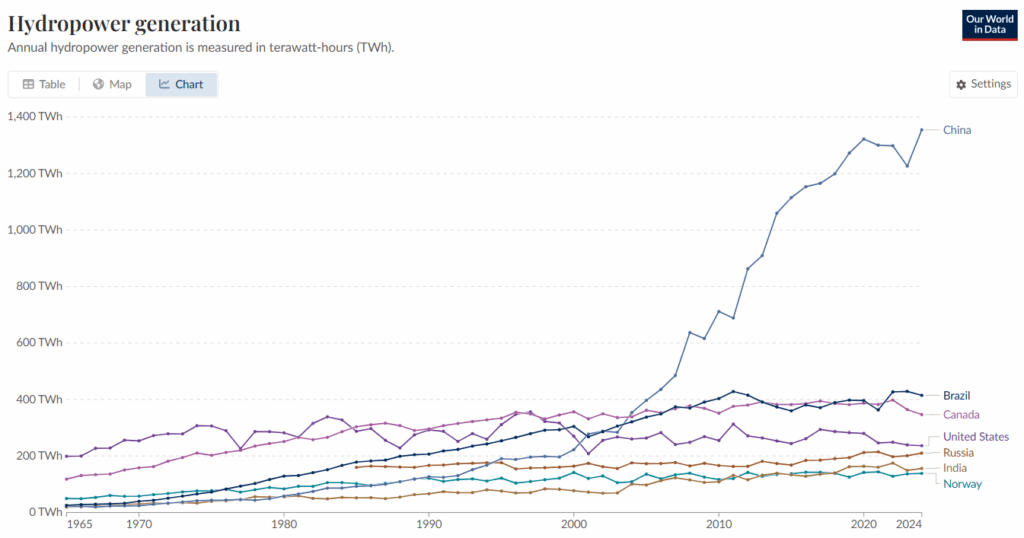
| Country | 1965 Hydropower Generation (TWh) | 2024 Hydropower Generation (TWh) |
| Brazil | 25.52 | 414.84 |
| Canada | 118.09 | 346.73 |
| China | 22.10 | 1354.43 |
| India | 19.17 | 156.21 |
| Norway | 49.45 | 138.50 |
| Russia | 0 | 210.35 |
| United States | 198.97 | 236.32 |
Instructions: Study the graph and data table above to answer the questions.
Question 1
Which country generated the most hydropower in 2024? How much of an increase was this from 1965?
Question 2
Calculate the increase in hydropower for the rest of the countries on the data table, from 1965 to 2024. List them in order of greatest to smallest increase.
Question 3
Looking at the table, what is one way that Norway’s hydropower generation trend (1965-2024) is different from Brazil’s? What could this tell you about the role of hydropower in Norway?
Question 4
Why do you think China’s hydropower generation grew much more than other countries in the last two decades? Explain your reasoning.
Question 5
Create a question from the data set and then answer it.
My Question:
My Answer: