
Note: “Other renewables” include geothermal, wind, and tidal.
Data Table
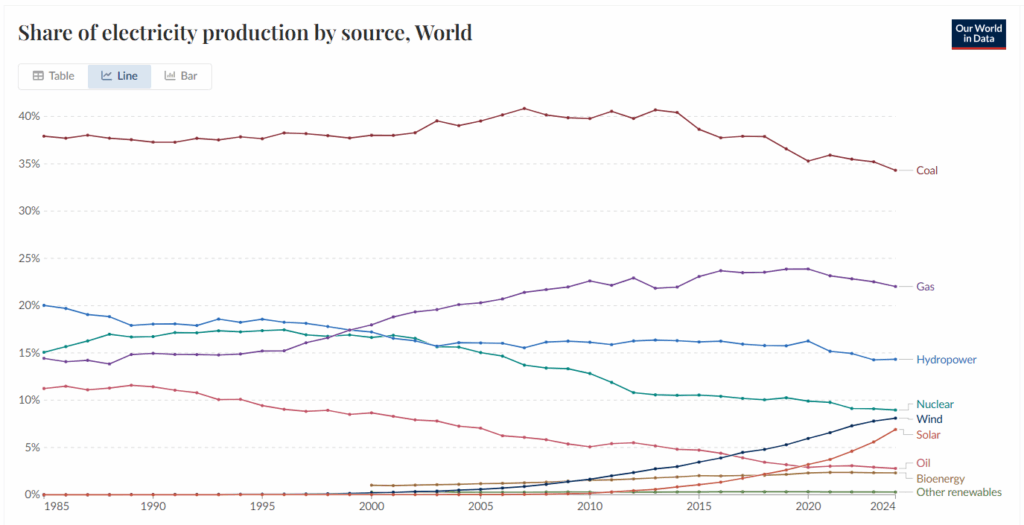
| Coal | Gas | Hydro-power | Nuclear | Wind | Solar | Oil | Bio-energy | Other Renew-ables | |
|---|---|---|---|---|---|---|---|---|---|
| 1990 | 37.29% | 14.95% | 18.05% | 16.73% | 0.03% | <0.01% | 11.42% | ||
| 2010 | 39.78% | 22.61% | 16.12% | 12.82% | 1.63% | 0.15% | 5.07% | 1.54% | 0.28% |
| 2024 | 34.32% | 22.03% | 14.32% | 8.96% | 8.09% | 6.91% | 2.78% | 2.31% | 0.29% |
Instructions: Study the graph and data table above to answer the questions.
Question 1
Why do you think coal remains a major source of electricity globally, even though its percentage has declined?
Question 2
Wind and solar have grown rapidly in recent years, yet they still make up a small share of generation. Explain why that might be.
Question 3
Which energy sources have declined over time, and what are some possible reasons for their decrease in use?
Question 4
Based on the trends shown in the graph, what energy source(s) do you think will continue to grow the most rapidly in the next decade? Explain why.
Question 5
How do economic, political, and environmental factors influence the types of energy countries choose to invest in?