
Introduction
In this lab, you’ll explore how electricity can be generated using just a magnet and a coil of wire—a process called electromagnetic induction. By changing the number of wire windings in your coil, you’ll see how it affects the voltage produced when the magnet moves through. This simple experiment models how generators work in real-world power plants. Your investigation will help you understand one of the key ways energy is transformed and used in our daily lives.
Materials (per group)
- 1 neodymium magnet
- 3-5 feet of copper wire (30 gauge)
- Hollow tube (plastic tube, spool, or cardboard)
- Voltmeter or multimeter
- Sandpaper
- Tape/marker/ruler
- Wooden skewer, dowel, or chopstick
- Optional: graphing paper or digital graphing tool
Procedure
- Prepare the coil: Use the marker to write your group’s assigned number of windings directly on the coil for easy identification. Before you start wrapping the copper wire around the coil, leave about 15 cm at the end and use tape to keep the starting coil in place.
- Create the coil: Wrap the copper wire tightly and neatly around your coil form for the number of turns your group was assigned. Leave about 15 cm of wire at the end once complete. Use a small piece of tape to secure each end so that the copper wire stays tightly wrapped around the coil.
- Prepare the wire ends: Carefully strip the enamel coating off both ends of the wire using sandpaper, exposing about 1 inch of bare wire so it can make good contact with the voltmeter or multimeter
- Set up your voltmeter: Connect the bare wire ends to the voltmeter or multimeter using tape. Make sure the voltmeter/multimeter ends are securely connected to the wire and won’t easily fall off. Make sure the device is set to measure in millivolts (mV).
- Set up your magnet: Attach the magnet to the skewer using tape. The orientation of the magnet is very important. Make sure the flat faces of the magnet point toward the coil’s ends (left and right), not upward or downward. Tape it securely.
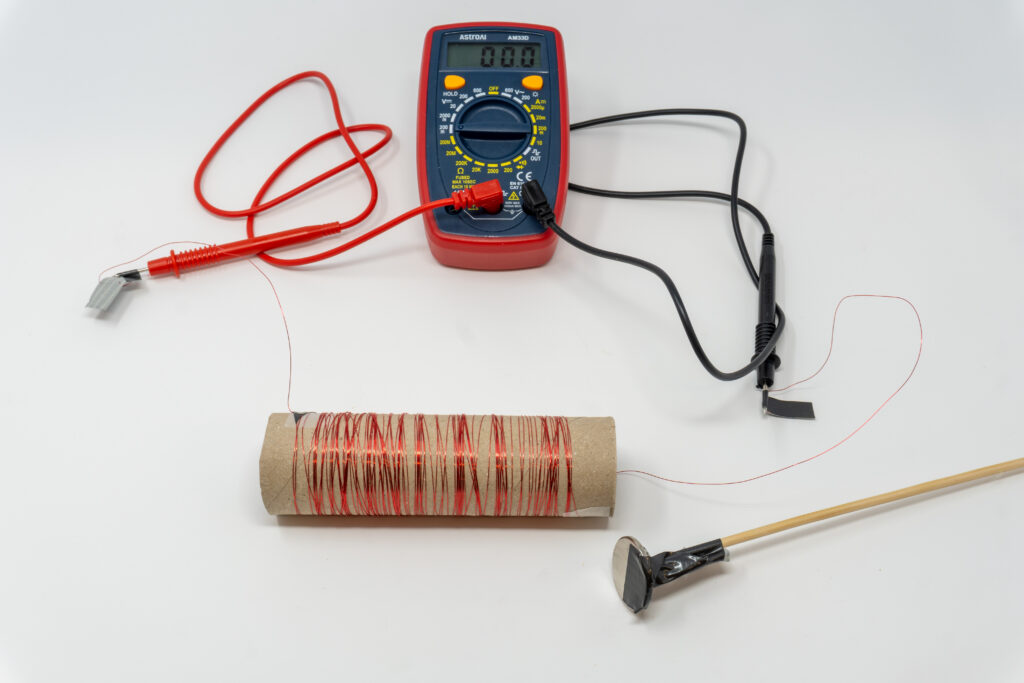
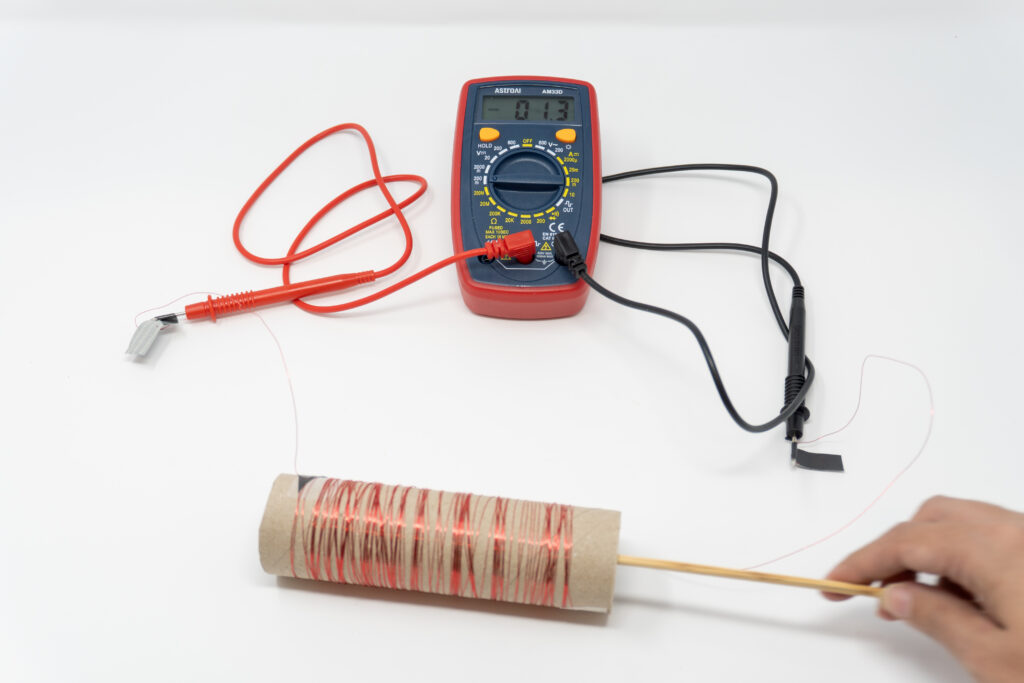
- Generate electricity: Quickly move the skewer with the magnet all the way through the center of the coil and then back out. Do this in one smooth motion. Watch the voltmeter and record the highest voltage (peak voltage) you observe during the motion.
Important: Record the absolute value of the largest voltage you observe, and ignore whether the value is positive or negative. If the voltage is negative, that just means the current is flowing in the opposite direction.
- Repeat trials: Practice perfecting your movement, and then do three official tests by performing the same motion with the magnet three times. Try to keep your speed and motion as consistent as possible. Record the peak voltage for each trial.
- Analyze your data: Calculate the average voltage from your three trials.
- Record and share: Fill in the data table with your results. Then share your group’s data with the class so everyone can contribute to a full-class graph showing the relationship between windings and voltage.
Data Table
Record the data from your group’s experiment below.
| Number of Windings | Trial 1 Peak Voltage (mV) | Trial 2 Peak Voltage (mV) | Trial 3 Peak Voltage (mV) | Average Voltage (mV) |
|---|---|---|---|---|
Now, collect data from the other student groups who conducted trials to find the average voltage for a different number of coils. Record the information in the data chart below.
All Student Groups Experiment Data
| Number of Windings | Average Voltage (mV) |
|---|---|
Optional: Using graphing paper or a digital graphing tool, create a line graph with the following elements. Plot your group’s result and those from the rest of the class to see the overall trend.
- X-axis: Number of Windings
- Y-axis: Average Voltage (mV)
- Graph title
Analysis Questions
- What trend did you observe between the number of coil windings and the average voltage produced?
- Why does increasing the number of turns in the coil increase the voltage generated? Use evidence from your data and what you know about electromagnetic induction.
- How would you describe the motion of the magnet in this experiment as a form of energy transfer? What kind of energy is being transferred, and into what form?
- How does this experiment model how electricity is generated in power plants? Name at least one real-world system that works in a similar way.
- What are some variables (other than the number of windings) that could affect the voltage generated in your coil? How could you test one of them in a future experiment?
- Imagine that your group was building a generator for a small wind turbine. Based on what you learned, what design decisions would you make about the wire coil? Explain.
- How did using a voltmeter help you gather reliable data in this investigation? Why is this tool important in studying electricity?
Assessment Rubric
| Category | Excellent | Proficient | Developing | Needs Improvement |
|---|---|---|---|---|
| Lab Setup and Participation | Students prepared materials, followed procedure accurately, and actively participated in all aspects of the lab. | Students followed directions mostly independently and accurately, and actively participated in most steps. | Students needed some reminders to stay on task, use materials correctly, and actively participate. | Students did not engage meaningfully, use materials correctly, or required frequent redirection. |
| Data Collection | Data is complete, accurate and neatly recorded in the table, with multiple trials included. | Data is mostly complete and accurate with minor errors or omissions. | Some data is missing or inconsistent; limited number of trials | Data is incomplete, disorganized, or missing altogether. |
| Analysis Questions | All questions are answered thoroughly with clear explanations and reasoning. | Most questions are answered with appropriate reasoning. | Some answers are incomplete or lack depth. | Responses are missing or show little understanding. |
| Optional: Graphing | The graph is neat and correctly labeled with title, axes, units, and accurately plotted data. | The graph includes most labels and data points are reasonably plotted. | Graph is missing labels or contains several plotting errors. | Graph information is unclear, missing or mostly incorrect. |