
Part 1: Analyzing the Wind Power Formula
What Factors Influence the Energy Output of a Wind Turbine?
Wind power produces energy by transforming the kinetic energy of the wind into mechanical energy that turns huge turbines that generate electricity. But what factors influence the amount of energy that these turbines produce? After discussing with your teacher and classmates, write down at least five factors that you think influence the energy output of a wind turbine.
| A. |
| B. |
| C. |
| D. |
| E. |
What is the Wind Power Formula?
| Wind Power | Power (W) = 0.5 x ρ x A x v3 |
Carefully study the table below to answer the following questions.
| p = Air Density | Air density mass per unit of volume of Earth’s atmosphere (1.225 kg/m3 at sea level), which changes with variations in altitude, atmospheric pressure, temperature and humidity. An increase in air density results in an increase in wind power available. Higher air density means the air is “heavier” or has more mass in each cubic meter. When heavier wind blows, more mass is hitting the turbine blades each second. More mass moving with the wind’s speed means more kinetic energy available to be captured. |
| A = Area swept by turbine blades | Area of a circle = πr2 r = radius; π = 3.14 |
| v = wind velocity | Speed (time/distance) m/s |
F. The W stands for Watts, a standard unit of power equal to one joule of energy per second. What does ρ stand for? ___________________________________
G. What are four factors that influence air density?
H. If air density increases, does wind power increase or decrease? ___________________________________
I. Explain why.
J. What does A stand for? ___________________________________
K. What is the formula to find the swept area? ___________________________________
L. What does v stand for? ___________________________________
M. What special instrument do you need to measure wind velocity? ___________________________________
Part 2: Building an Anemometer and Calibration
Follow the steps below to build a basic working anemometer to measure wind speed.
Step 1: Gather the materials provided by your teacher
- Small paper cups (x4)
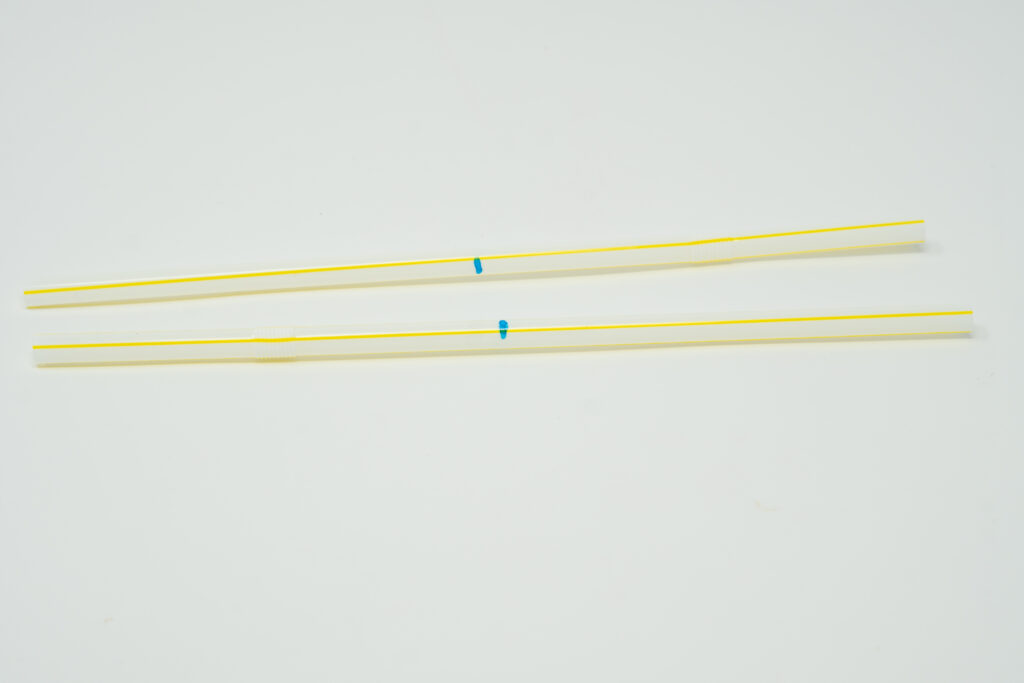
- Straws (x2)
- Tape
- Paper clip
- Push pin
- Pencil with eraser
- Permanent marker
- Ruler or measuring tape
Step 2: Prepare the straws
- Lay the first straw on the table.
- Use the ruler to find the centerpoint of the straw.
- Mark the center with a permanent marker.
- Do the same with the second straw.
Step 3: Prepare the cups
- Cut each cup in half and keep only the bottom-half of the cup.
Step 4: Attach the cups
- Take one paper cup half and cut two holes on either side to insert the straw through. Tape one end of the straw, so that it is secure.
- Do the same with the second paper cup, and insert the other side of the straw through, with the open side facing the opposite direction as the first cup.
- Repeat this process for the second straw and the remaining two cups.

Step 5: Make the X shape
- Lay the two straws across each other to form an even X shape. Arrange the position of the straws so that each cup faces the back of the next cup.
- Line up the center marks on the straws you made earlier so that the X is balanced.
- Tape the two straws together at the center where they cross.
Step 6: Attach to the pencil and mark one cup
- Carefully push the pin through the center where the straws cross. Move the push pin around to make an easy pathway for the paper clip to go through.
- Remove the push pin. Then straighten out the paper clip as much as you can.
- Hold the X shape steady over the eraser of the pencil.
- Push the straightened paper clip through the center of the straws where you made the hole with the push pin, and into the middle of the eraser. Make sure it’s not too tight. The straws need to spin freely around the paper clip.
- With the marker, color-in the side of one cup so that it is easily identifiable from the other three.

Step 7: Test the movement
- Gently blow on the cups to check if the straws rotate.
- Adjust the straws and cups slightly if they don’t spin easily.
Step 8: Test in wind
- Place your anemometer in front of a fan.
- Turn on the fan and observe. The cups should spin freely.
- Try changing the fan’s speed and make any adjustments to maintain uniform motion.
Wind Speed Calibration
Next, you will measure how fast the cups on your anemometer spin, and use that information to calculate wind speed in meters per second (m/s). This process is called calibration. You’ll be using math and physics to turn a simple spinning device into a scientific instrument.
Step 9: Gather your materials – stopwatch/timer, anemometer, calculator.
Step 10: You will conduct three trials for three different fan settings (low, medium, high), calculating the average revolutions per minute for each setting. Fill in the tables below as you conduct the trials.
A. Low Fan Setting Data Table
| Fan Setting (Low) | Revolutions in 60 seconds (one minute) |
|---|---|
| Trial #1 | |
| Trial #2 | |
| Trial #3 |
B. Medium Fan Setting Data Table
| Fan Setting (Medium) | Revolutions in 60 seconds (one minute) |
|---|---|
| Trial #1 | |
| Trial #2 | |
| Trial #3 |
C. High Fan Setting Data Table
| Fan Setting (High) | Revolutions in 60 seconds (one minute) |
|---|---|
| Trial #1 | |
| Trial #2 | |
| Trial #3 |
Now that you have the average revolutions per minute for each of your settings, you can calculate wind speed in kilometers per hour. It takes several steps, so follow the instructions carefully.
Step 11: Measure distance per revolution.
D. Measure the diameter of your anemometer’s circular path (cm) _________________________
E. The distance per revolution (cm) can be found with the following formula: π x diameter (Note: You may use 3.14 for π) _________________________
Step 12: Using the average revolutions per minute and distance per revolution, calculate the wind speed in meters per second. Show your work.
F. Low Fan Setting Calculations Table
| Low Fan Setting (wind speed in m/s) |
G. Medium Fan Setting Calculations Table
| Medium Fan Setting (wind speed in m/s) |
H. High Fan Setting Calculations Table
| High Fan Setting (wind speed in m/s) |
Step 13: Fill in the Final Wind Speed Table
I. Final Wind Speed Table
| Fan (Low) | Fan (Medium) | Fan (High) | |
| Final Wind Speed (m/s) |
Part 3: Simulated Windmill Calculations
Now that you have the wind speed data, it’s time to use the wind power formula to compare energy output at a location of your choice within your state or region, where you think a wind turbine might ideally be located.
Remember, the wind power formula: Power (W) = 0.5 x ρ x A x v3 Where ρ stands for air density, A stands for area swept by turbine blades, and v stands for wind velocity or speed.
Step 1: Choose one location in your region or state where you think a wind turbine could possibly be built. Make sure it’s an area where weather data such as temperature, humidity and air pressure is readily available and can be researched. Write the name of your (a) Location in the Wind Turbine Survey Data Table below.
STEP 2: Using your anemometer data from the previous lesson, plug in the three final wind speeds you recorded and converted to m/s in the (b) Wind Speed column of the Wind Turbine Survey Data Table below.
STEP 3: A mid-size wind turbine could have a blade length of 40 meters. Calculate the area (m2) swept by turbine blades using this fixed turbine parameter and enter the (c) Wind Swept Area in the Wind Turbine Survey Data Table table below. Area = πr2
STEP 4: Use this Air Density Calculator to calculate the air density (km/m3) of your chosen location. Since temperature, humidity and air pressure change constantly, do some research to find the approximate averages for your specific month and chosen location. For altitude, try to find the closest number you can for the location you chose.
A. _________________________ Month
B. _________________________ Average Temperature
C. _________________________ Average Humidity
D. _________________________ Average Air Pressure
E. _________________________ Altitude
The air density calculator shows many different units, so be certain to select the value reported in km/m3). Using the Air Density Calculator, enter your data, then scroll down to determine the air density at the average temperature in degrees Celsius. Plug the (d) Air Density in the Wind Turbine Survey Data Table below.
F. Wind Turbine Survey Data Table
Location: _________________________
| Wind Speed (m/s) | Wind Swept Area (m2) | Air Density (kg/m2) |
|---|---|---|
| _______________ Low _______________ Medium _______________ High | _______________ Wind Swept Area Area = pi(r-squared) | _______________ Air Density (Using the Air Density Calculator, enter your data then scroll down to determine the air density at the average temperature in degrees Celsius) |
Step 5: Show your work. Remember to cube the wind velocity!
G. Wind Power Calculations Table
| Calculate: Power (W) = 0.5 x p x A x v3 | Potential Wind Power (W) |
| Wind Speed #1: | |
| Wind Speed #2: | |
| Wind Speed #3: |
Step 6: Answer the Reflection and Analysis questions based on the results of your investigation.
H. This model assumes 100% efficiency, but real turbines are often only ~40% efficient due to wind patterns. (Multiply final answers by 0.4 to simulate real-world conditions.)
I. Based on your results, would it make sense to install a wind turbine at your testing location? Why or why not?
J. How would a small increase or decrease in wind speed affect the power output? Explain. (Hint: Think about the exponent of wind speed.)
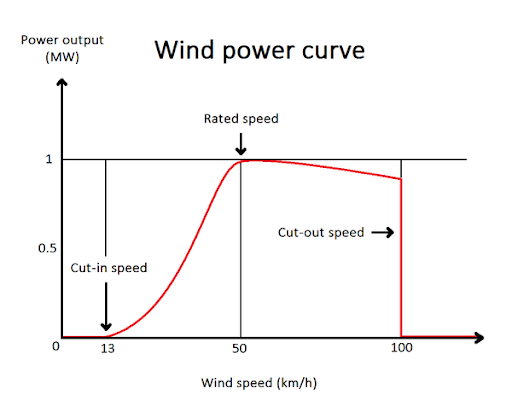
Take a moment to study the wind power curve diagram above, showing the arbitrary power curve of a 1MW turbine compared to wind speed. The cut-in speed is the point at which the wind turbine is able to generate power. The cut-out speed is the point at which the turbine must be shut down to avoid damage to the equipment. The cut-in and cut-out speeds are related to turbine design and size and are decided on prior to construction.
K. What happens to the power output after the cut-out speed is reached? What could be the reasons for this sudden drop?
L. If a location frequently experiences wind speeds of 40 km/h, what would be the expected performance of the turbine? How might engineers use this graph to choose the best site to install a wind turbine?
M. How does this power curve illustrate the intermittent nature of wind energy?
N. What are some real-world factors engineers must consider beyond just wind speed when planning for wind turbines?
O. How accurate do you think your wind speed measurements are? What could contribute to inaccurate measurements? Which measurements were the most difficult to determine?