
Source: Our World in Data
Data Table
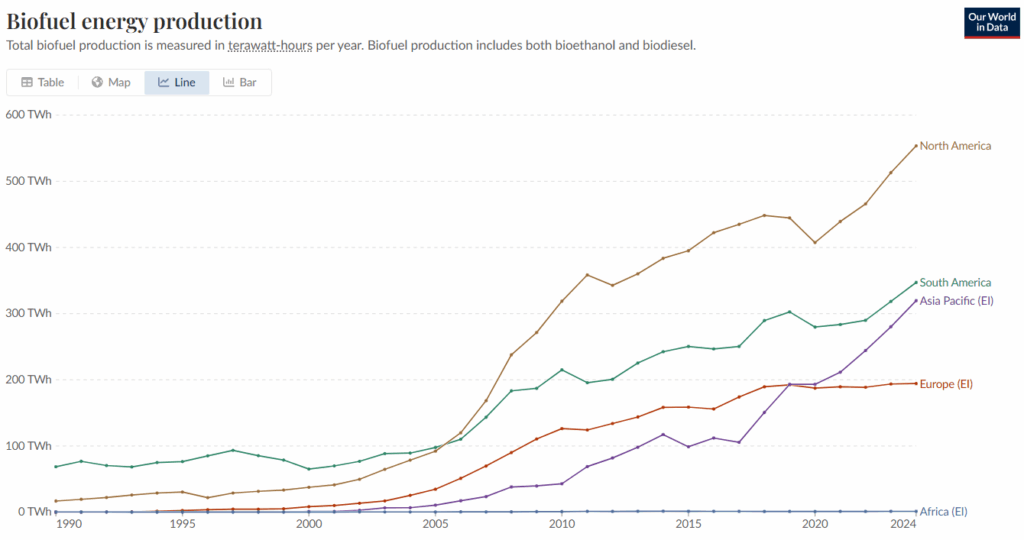
| 1990 | 2000 | 2010 | 2020 | 2024 | |
|---|---|---|---|---|---|
| Africa | 0.31 TWh | 0.07 TWh | 0.82 TWh | 0.97 TWh | 1.15 TWh |
| Asia Pacific | 0.00 TWh | 1.00 TWh | 42.82 TWh | 193.14 TWh | 319.57 TWh |
| Europe | 0.07 TWh | 8.13 TWh | 126.24 TWh | 187.47 TWh | 194.29 TWh |
| North America | 16.73 TWh | 37.57 TWh | 318.85 TWh | 407.46 TWh | 553.64 TWh |
| South America | 68.51 TWh | 65.07 TWh | 215.08 TWh | 279.75 TWh | 347.18 TWh |
Instructions: Study the graph and data table above to answer the questions.
Question 1: Which region had the highest biofuel energy production from 1990 to 2000? By how many terawatt-hours did this region increase its energy production from 1990 to 2024?
Question 2: Compare Europe’s biofuel energy production to Asia-Pacific’s, from 2020 to 2024. What might this suggest about the current energy priorities of these regions?
Question 3: Why might the region of Africa have lower biofuel energy production levels, despite having large agricultural areas? What factors could be influencing this trend?
Question 4: Do you think biofuel energy production will continue to increase in the next two decades? Provide evidence from the data to support your answer.
Question 5: Create a question from the data and answer it.
My Question:
My Answer: