
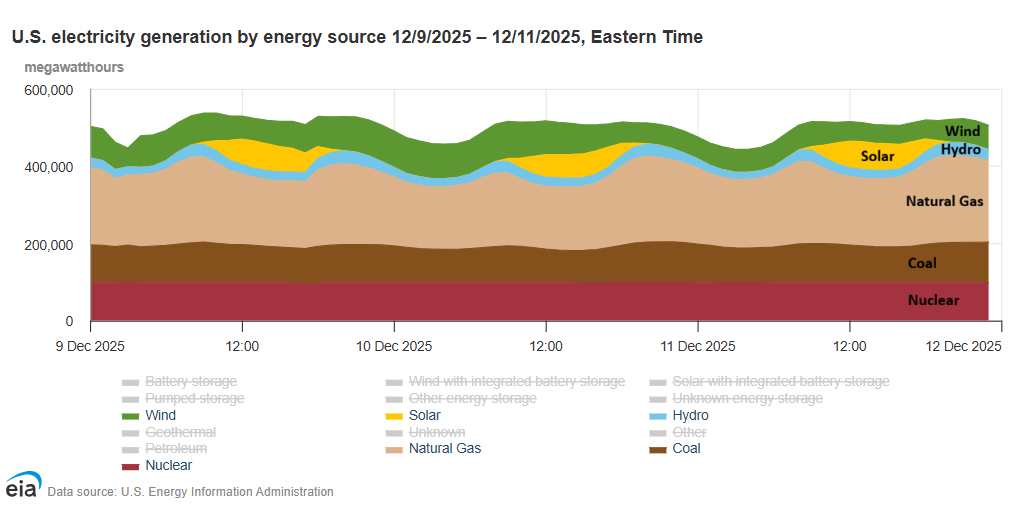
Instructions: Below is a snapshot of U.S. electricity generation by major sources over a 3-day period in December 2025. Use the information provided in the graph to answer the questions below.
Question 1: Which energy sources show the greatest variability, and which remain constant? What physical or technological characteristics explain these differences?
Question 2: Solar production shows sharp daily peaks and zero output at night. How might this pattern affect how the grid operators plan for meeting demand?
Question 3: Wind and natural gas often appear to move in opposite directions. What does this suggest about how the grid uses natural gas to support alternative energy sources like wind?
Question 4: How might the addition of large-scale battery storage change the patterns you see in natural gas electricity production?
Question 5: If you were a grid operator, what information from this graph would be most useful when planning ahead?
Question 6: How does the visual pattern of the graph illustrate the challenges of balancing supply and demand in real time?