
Data Table
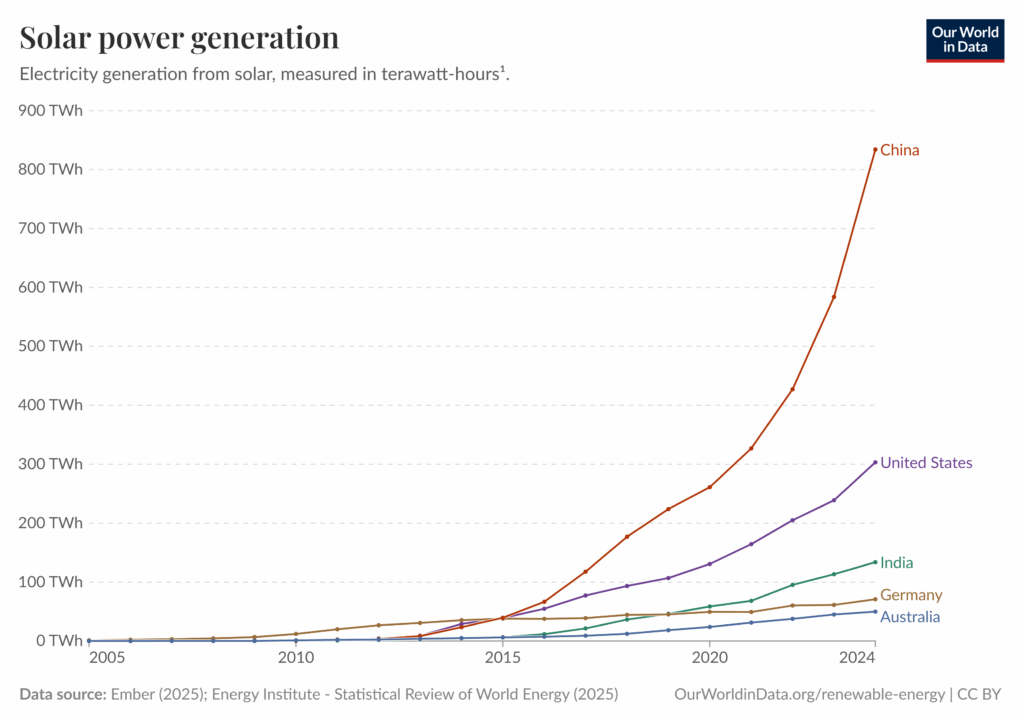
| Country | Solar Production (TWh, 2024) |
|---|---|
| Australia | 49.84 |
| China | 834.10 |
| Germany | 70.99 |
| India | 133.81 |
| United States | 303.17 |
Instructions: Study the graph and data table above to answer the questions.
Question 1
What percentage of the total solar energy produced by these five countries in 2024 was generated by China? Round your answer to the nearest whole number. Hint: Find the sum of total solar energy output. Then divide by China’s solar energy output and multiply by 100.
Question 2
Germany has roughly triple the population of Australia in one-twentieth of the land area. Despite these differences, the two countries have similar levels of solar energy production in 2024. Discuss one possible reason why Australia, despite its large land area and high solar potential, produces less solar energy than Germany.
Question 3
Compare China’s 2024 solar production to Australia’s. What might this suggest about differences in government policy, investment, or energy needs between these countries?
Question 4
2014-2024 has seen a general increase or upward trend in solar energy production for these five countries. Predict what you think the trend will be for the next ten years and explain your reasoning.
Question 5
Create a question from the data set and answer it.
My Question:
My Answer: