
Instructions: Study the graph above to answer the questions.
Question 1
In Science of Wind, Dr. Tinker says “Wind farms produce electricity according to when and how the wind is blowing. Unfortunately, that doesn’t usually match the way we use electricity, so we need something to power this when this [the turbine] isn’t turning.”
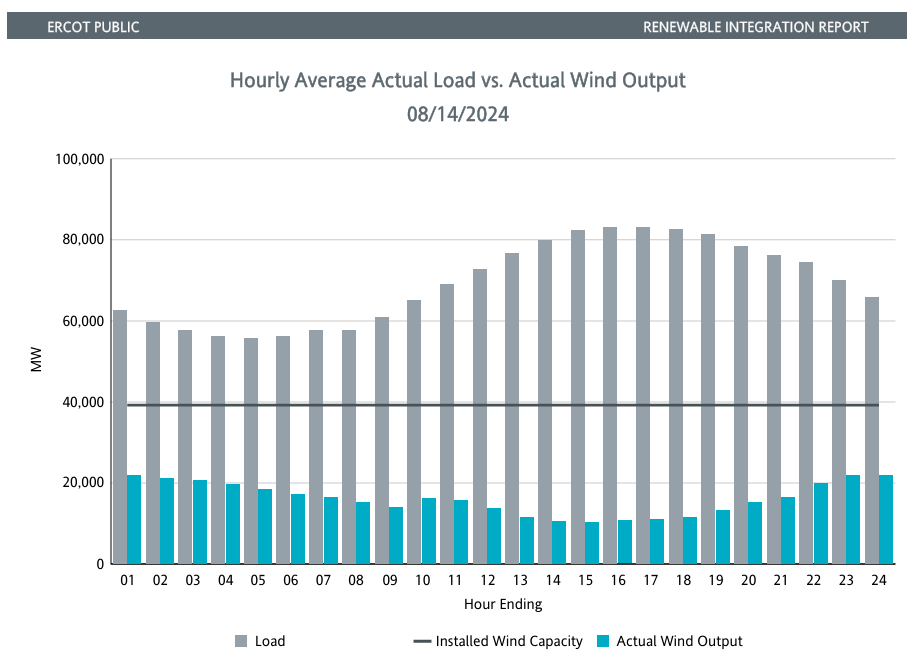
Based on the graph above from the Electric Reliability Council of Texas (ERCOT), consider the electricity demand curve for a summer week in Texas. Notice the difference in scale between electricity demand (load) and the actual wind energy produced. Demand often significantly exceeds the amount of electricity generated by wind, even in Texas, the state with the highest wind power capacity in the U.S.
What time of day is the demand (load) for electricity highest? Why might that be?
Question 2
Does consumer demand for electricity correspond with wind blowing periods? Explain.
Question 3
Notice the line showing Installed Wind Capacity. Why do you think the actual wind output is far below the full capacity of the installed wind turbines?
Question 4
What factors should a community consider when choosing between hydropower and natural gas as a backup source for wind energy?
Question 5
What changes or solutions do you think are needed to make wind energy a more reliable source of electricity? Explain your reasoning.