
Data Table
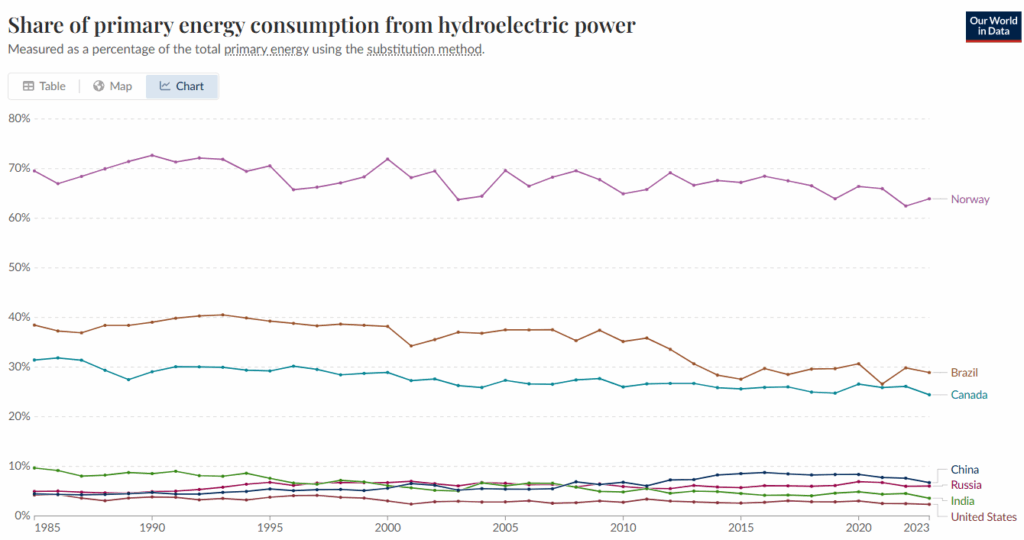
| Country | 1985 | 2023 |
| Brazil | 38.5% | 28.9% |
| Canada | 31.4% | 24.4% |
| China | 4.4% | 6.7% |
| India | 9.7% | 3.6% |
| Norway | 69.5% | 63.9% |
| Russia | 4.9% | 6.0% |
| United States | 4.2% | 2.3% |
Instructions: Study the graph and data table above to answer the questions.
Question 1
Which countries increased their share of primary energy consumption from hydroelectric power, comparing rates from 1985 to 2023, and by how much?
Question 2
Does a decrease in the share of hydroelectric power mean less production of it? Why or why not?
Question 3
What economic and environmental impacts, positive and negative, could large increases in the use of hydroelectric dams for energy have on a country or region?
Question 4
Most countries represented in the data have remained relatively constant in their share of primary energy consumption from hydroelectric power from 1985-2023. What might be one reason why?
Question 5
Analyze the sharp contrast in the hydroelectric share between Norway and countries like India and the United States. What geographic, economic, and political factors could contribute to Norway’s ability to rely so heavily on hydroelectricity?