
Source: https://ourworldindata.org/grapher/per-capita-co2-coal?tab=chart&time=earliest..2023
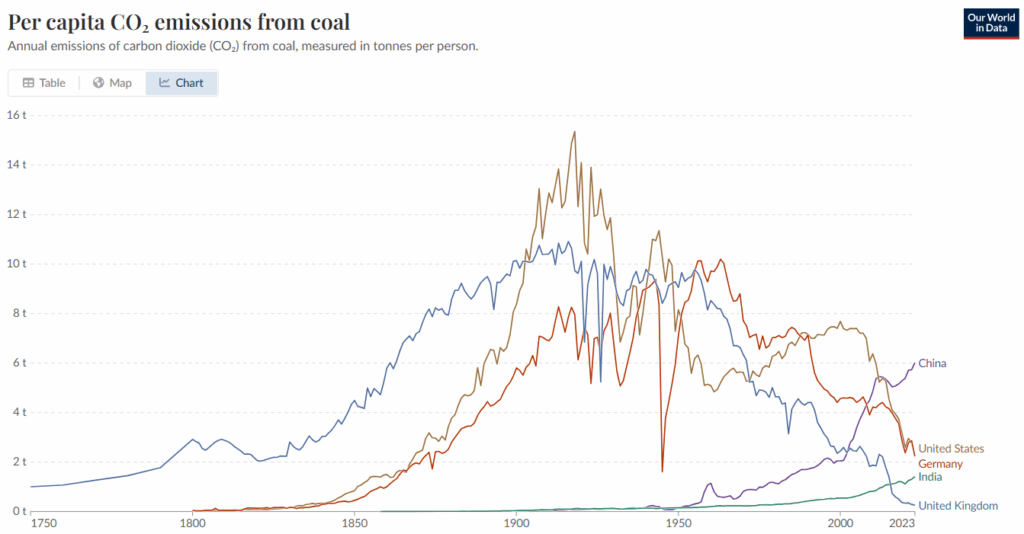
Data Table: Per Capita CO2 Emissions from Coal, measured in tonnes per person
| 1850 | 1900 | 1950 | 2000 | 2023 | |
| China | 0.14 | 2.05 | 6.01 | ||
| Germany | 0.45 | 5.80 | 7.11 | 4.57 | 2.23 |
| India | 0.04 | 0.15 | 0.54 | 1.41 | |
| United Kingdom | 4.49 | 10.14 | 9.06 | 2.45 | 0.26 |
| United States | 0.84 | 8.37 | 8.15 | 7.69 | 2.26 |
Instructions: Study the graph and data table above to answer the questions.
Question 1
In 1950, which country had the highest per capita CO2 emissions from coal? In 2000? In 2023?
Question 2
What patterns do you notice when analyzing the per capita CO2 emissions from coal over time of the five countries shown, from 1850-2023?
Question 3
China’s per capita emissions from coal have now surpassed those of the United States and continue to climb, while the United States’ emissions from coal are on the decline. What might explain this shift?
Question 4
India’s per capita emissions are rising steadily. If this trend continues, what might be some environmental or economic impacts for India in the future?
Question 5
Why do you think the United Kingdom’s emissions from coal peaked around the early 1900s and then declined rapidly afterward?