
The graph below shows the energy intensity for various electrical uses. Energy intensity describes how much energy is used to provide a household service, such as heating, cooling, or lighting. When energy intensity decreases, it usually means homes are providing the same services while using less energy, often due to improvements in technology or efficiency.
Residential Energy Intensity, 2000-2023, United States
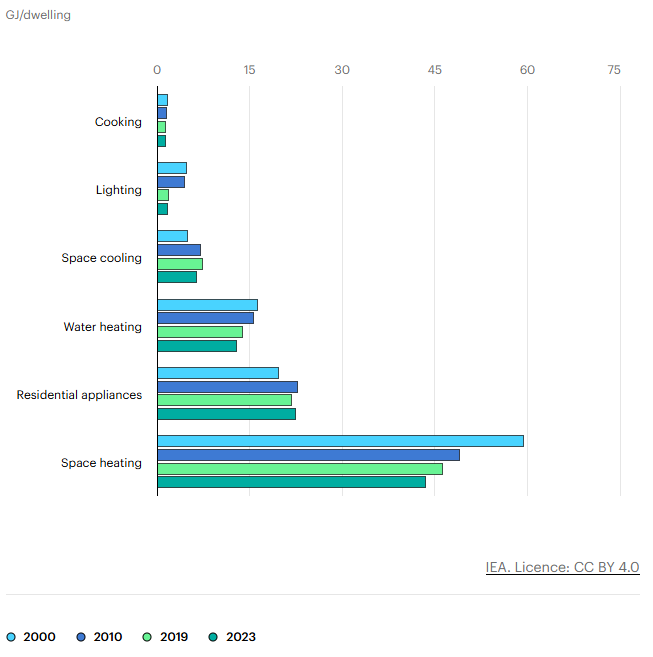
Source: IEA
Instructions: Study the graph above to answer the questions.
Question 1: Describe the overall trend in residential energy intensity in the United States between 2000 and 2023. For most household uses, is energy intensity increasing, decreasing, or staying about the same? What does this suggest about changes in home energy use over time?
Question 2: Most household uses show a decrease in energy intensity from 2000 to 2023. Identify one use that does not follow this pattern. What might explain why this use differs from the others?
Question 3: Choose one or two household uses that show a clear decrease in energy intensity. Explain how improvements in technology or home design (such as insulation, heating/cooling systems, or appliance efficiency) could have contributed to this change. Use evidence from the graph to support your answer.
Question 4: The graph shows energy intensity per dwelling, not total residential energy use. Explain how total residential energy use in the United States could increase over time, even if energy intensity is decreasing.