
Cleaning Up an Oil Spill: Investigative Lab – Student Handout
Summary
This printable oil spill investigative lab student handout provides a structured framework for students to conduct their experiment. It guides them through a clear procedure for data collection and includes tables for recording their findings. The handout also features analysis questions that challenge students to connect their lab results to real-world implications of oil spills and suggest possible improvements.
Procedure
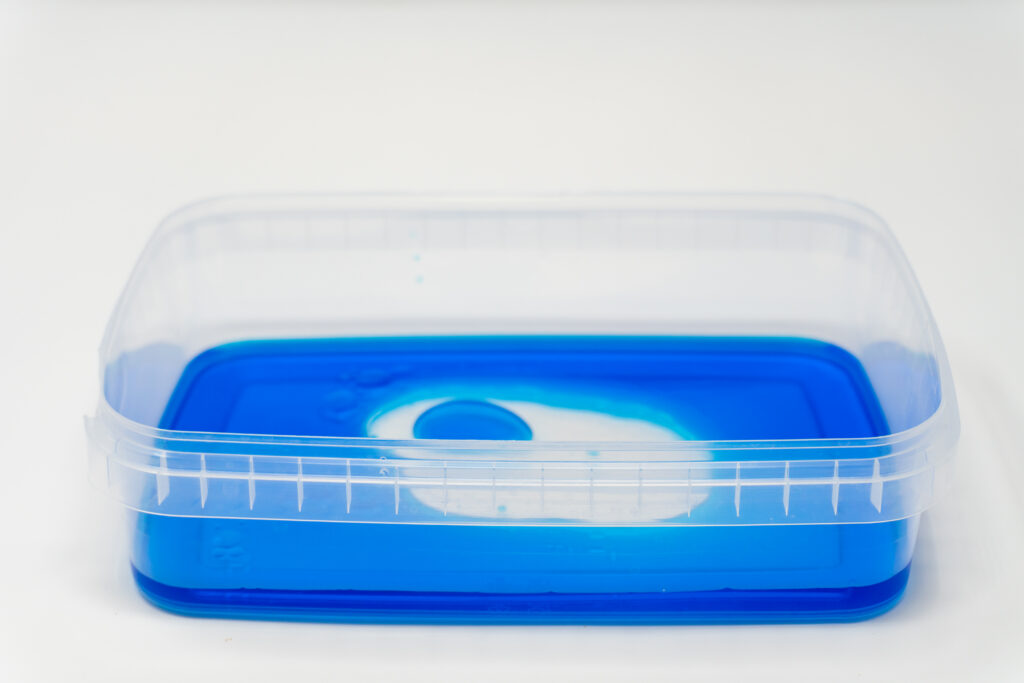
- Fill the bowl or tray with 80 mL of water. If using food coloring, add a few drops.
- Measure out 20 mL of vegetable oil in the graduated cylinder and pour it slowly onto the surface of the water. Observe and record how the oil behaves.
- Use the timer to limit the time spent on each cleanup method to 5 minutes.
- Choose one cleanup method to test first. Attempt to clean up the oil spill with one of the selected materials (e.g., paper towels, cotton balls, siphoning with an eye dropper, stirring) and observe how well it removes or absorbs the oil.
- After the 5 minutes, pour the remaining water and oil into the 100mL graduated cylinder. Let the water and oil separate and settle. Measure the oil remaining from the original “spill” and subtract that from the original 20mL.
- Record the volume of oil remaining and then calculate the volume of oil removed.
- Repeat the process with the other cleanup materials, making sure to start with a fresh bowl of water each time, or carefully remove any remaining oil.
- Once completed with all the tests, fill out the “Class Reporting Table” for each cleanup method to compare results and determine which method was the most effective at removing the oil.
TABLE 1: Data Collection
Note: Use this table or create your own (based on teacher instructions) for data collection.
| Clean Up Method | Original Volume of Oil (mL) | Volume of Oil Remaining (mL) | Volume of Oil Removed (mL) | Effectiveness (1-5) | Observations / Notes |
|---|---|---|---|---|---|
| Paper Towels | |||||
| Cotton Balls | |||||
| Eye Dropper | |||||
| Spoon | |||||
| Polar Fleece |
TABLE 2: Cleanup Method Group Chart
Note: One chart needs to be created for each clean up method tested.
| Clean-up method: |
| Group Name | Volume of Oil Removed (mL) | Effectiveness Rating (1-5) | Observations / Notes |
|---|---|---|---|
| Group #1 | |||
| Group #2 | |||
| Group #3 | |||
| Group #4 | |||
| Group #5 |
Analysis Questions
- Which method was the most effective at removing oil? Explain why.
- Which method was the least effective? Explain why.
- How well would the most effective method translate to real-world oil spill cleanup? What might be some challenges on a large scale?
- What are possible environmental impacts the cleanup method could have?
- How could technology improve oil spill clean-up efforts?